🎓 edX E‑eshe · Ethiopia
HORT 202 · Plant Biochemistry
📊 Diagrams & Images Library
All visual resources for Plant Biochemistry · HORT 202
No matching images found. Try a different search term.
🧬 Module I · Molecular Foundations

Water Molecule Structure
Hydrogen bonding between water molecules, showing polarity (δ⁻, δ⁺)
images/01_water_molecule_hbonding.png

Five Properties of Water
Cohesion, adhesion, surface tension, heat capacity, universal solvent
images/02_water_properties_complete.png

Water Properties Infographic
Summary with horticultural applications
images/03_water_properties_infographic.png
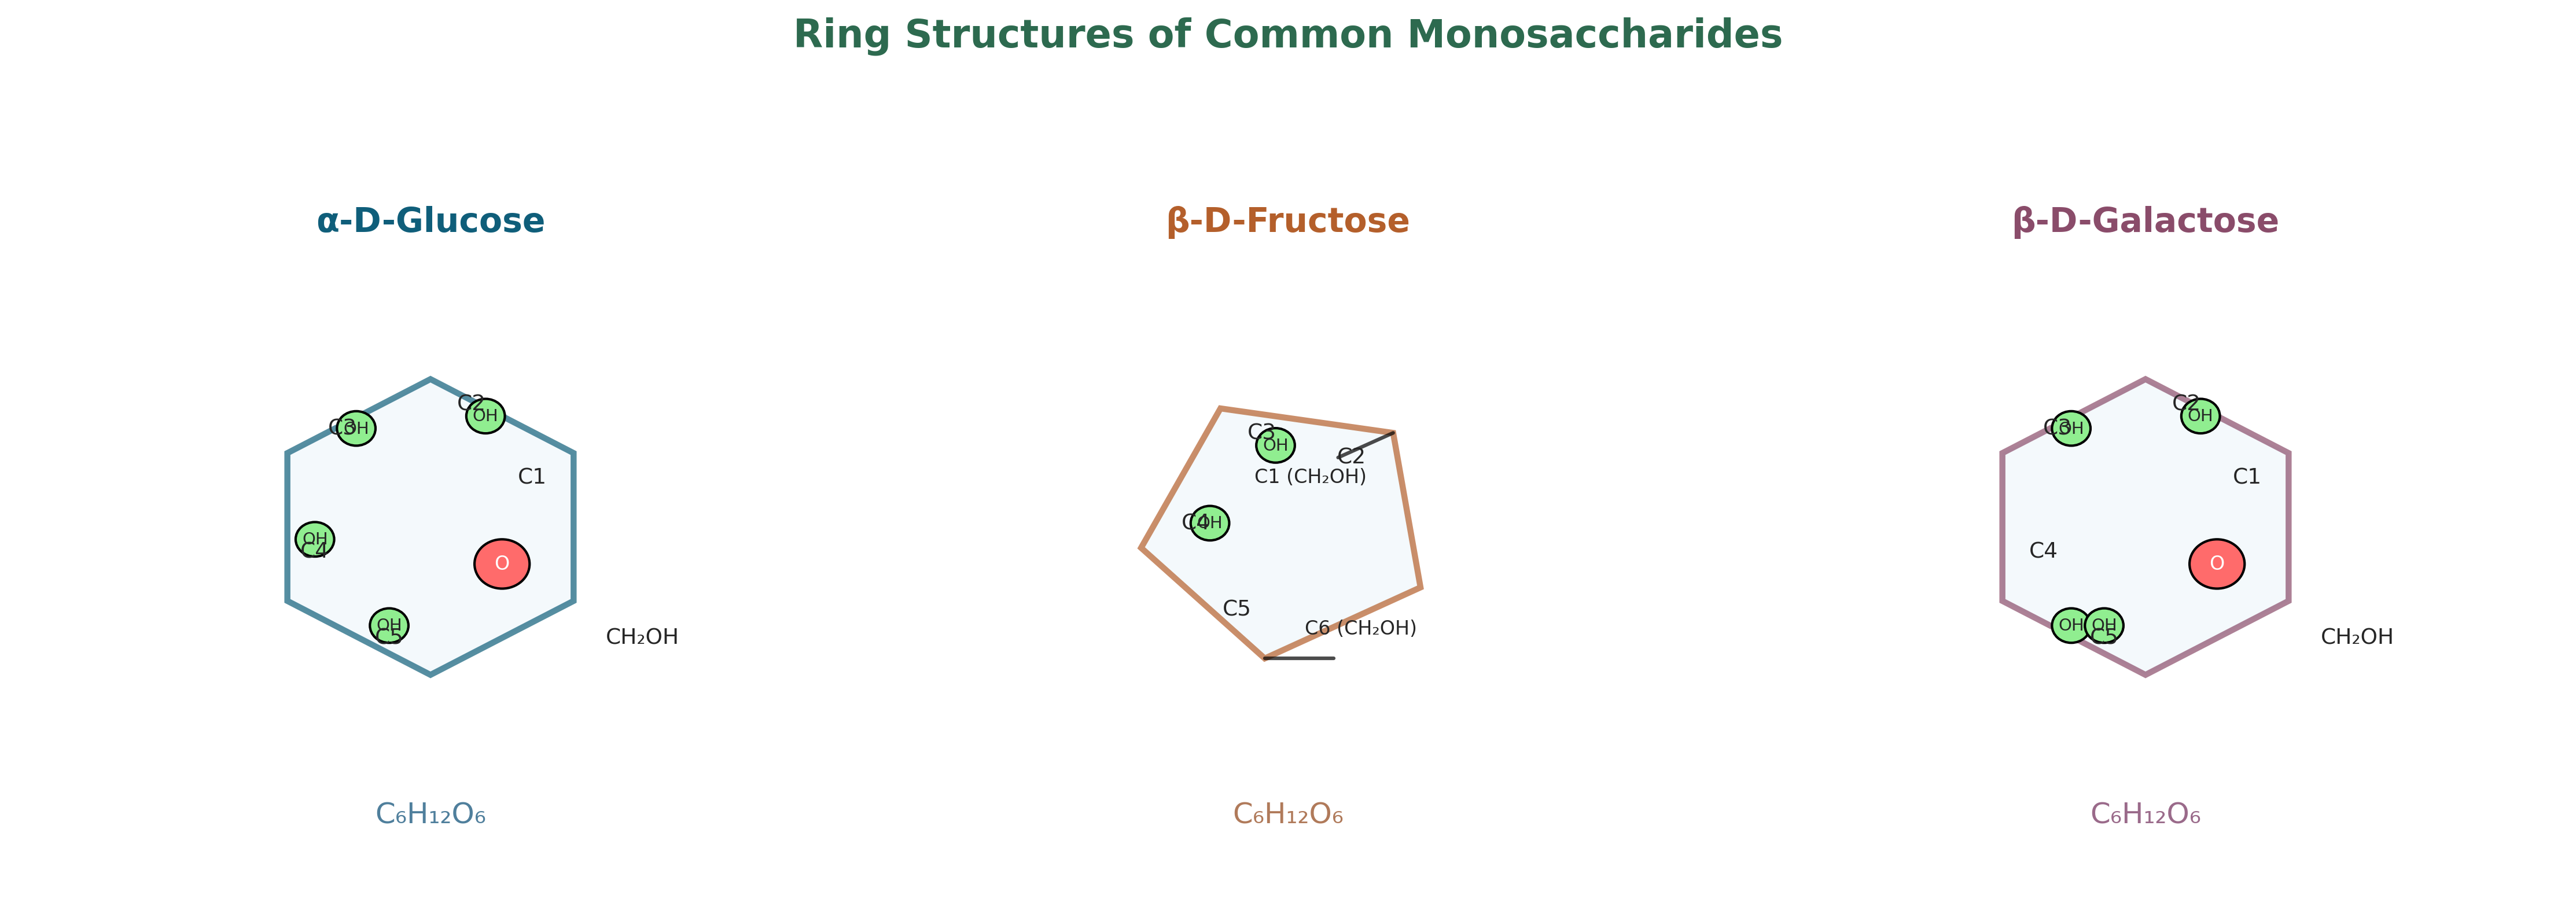
Monosaccharide Ring Structures
Glucose, fructose, and galactose
images/01_sugar_ring_structures.png

Glucose Ring Formation
Cyclization from linear to ring form
images/03_glucose_ring_formation.png

Sucrose Formation
Three stages of glycosidic bond formation
images/01_sucrose_formation_stages.png

Sucrose Detailed Structure
α1→β2 glycosidic bond
images/02_sucrose_detailed_structure.png
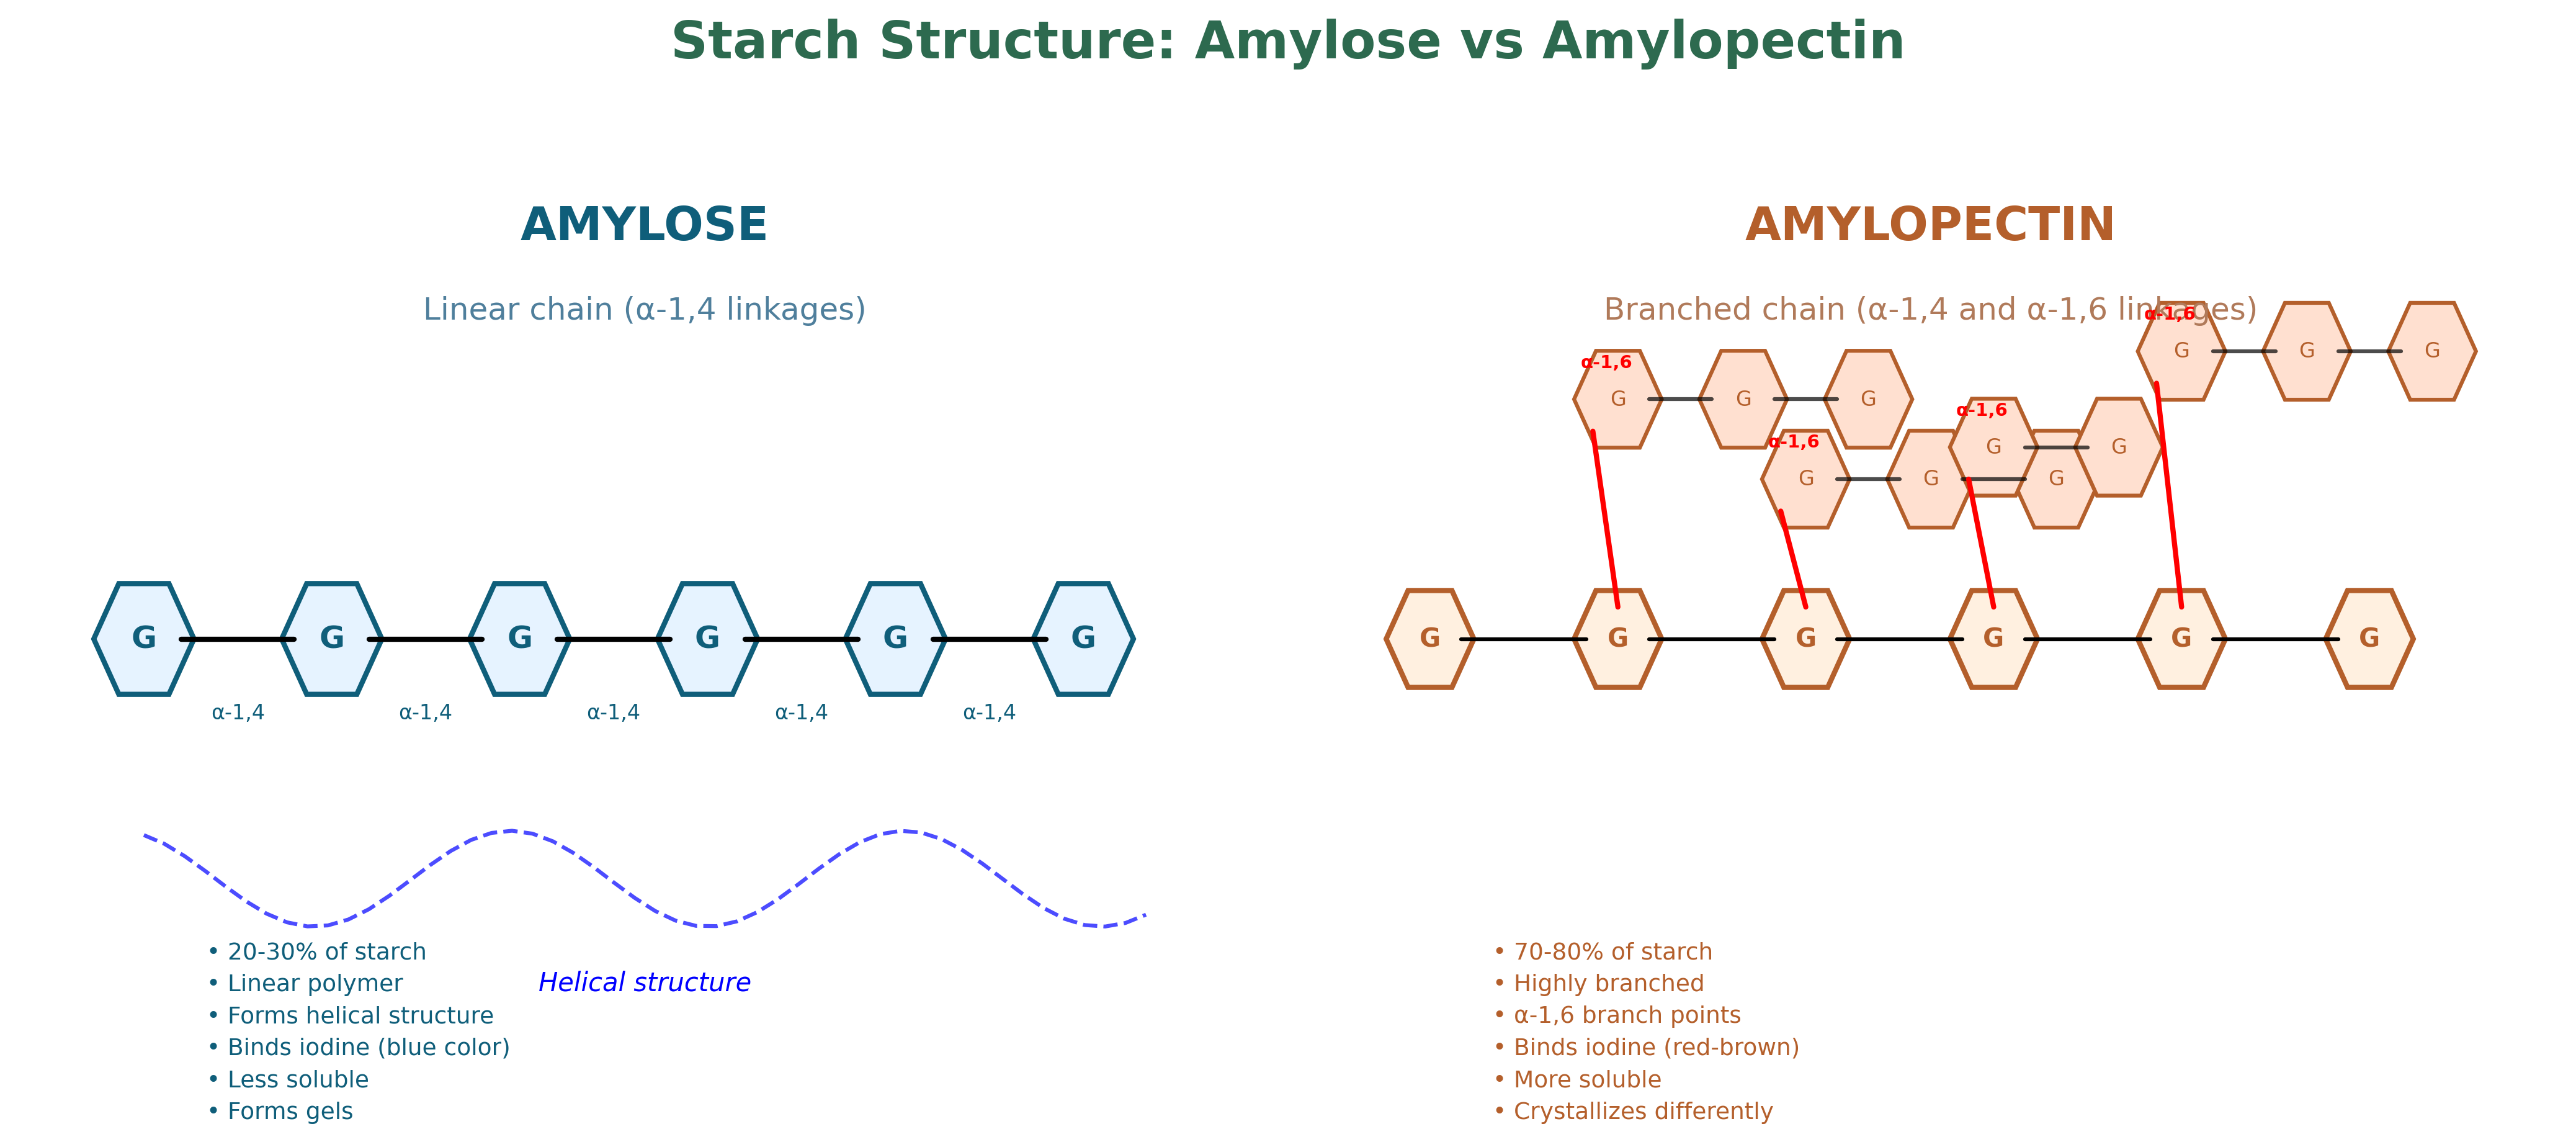
Amylose vs Amylopectin
Linear and branched starch structures
images/01_starch_comparison.png

Amylopectin Branch Point
α-1,6 linkage detail
images/02_amylopectin_branch_point.png
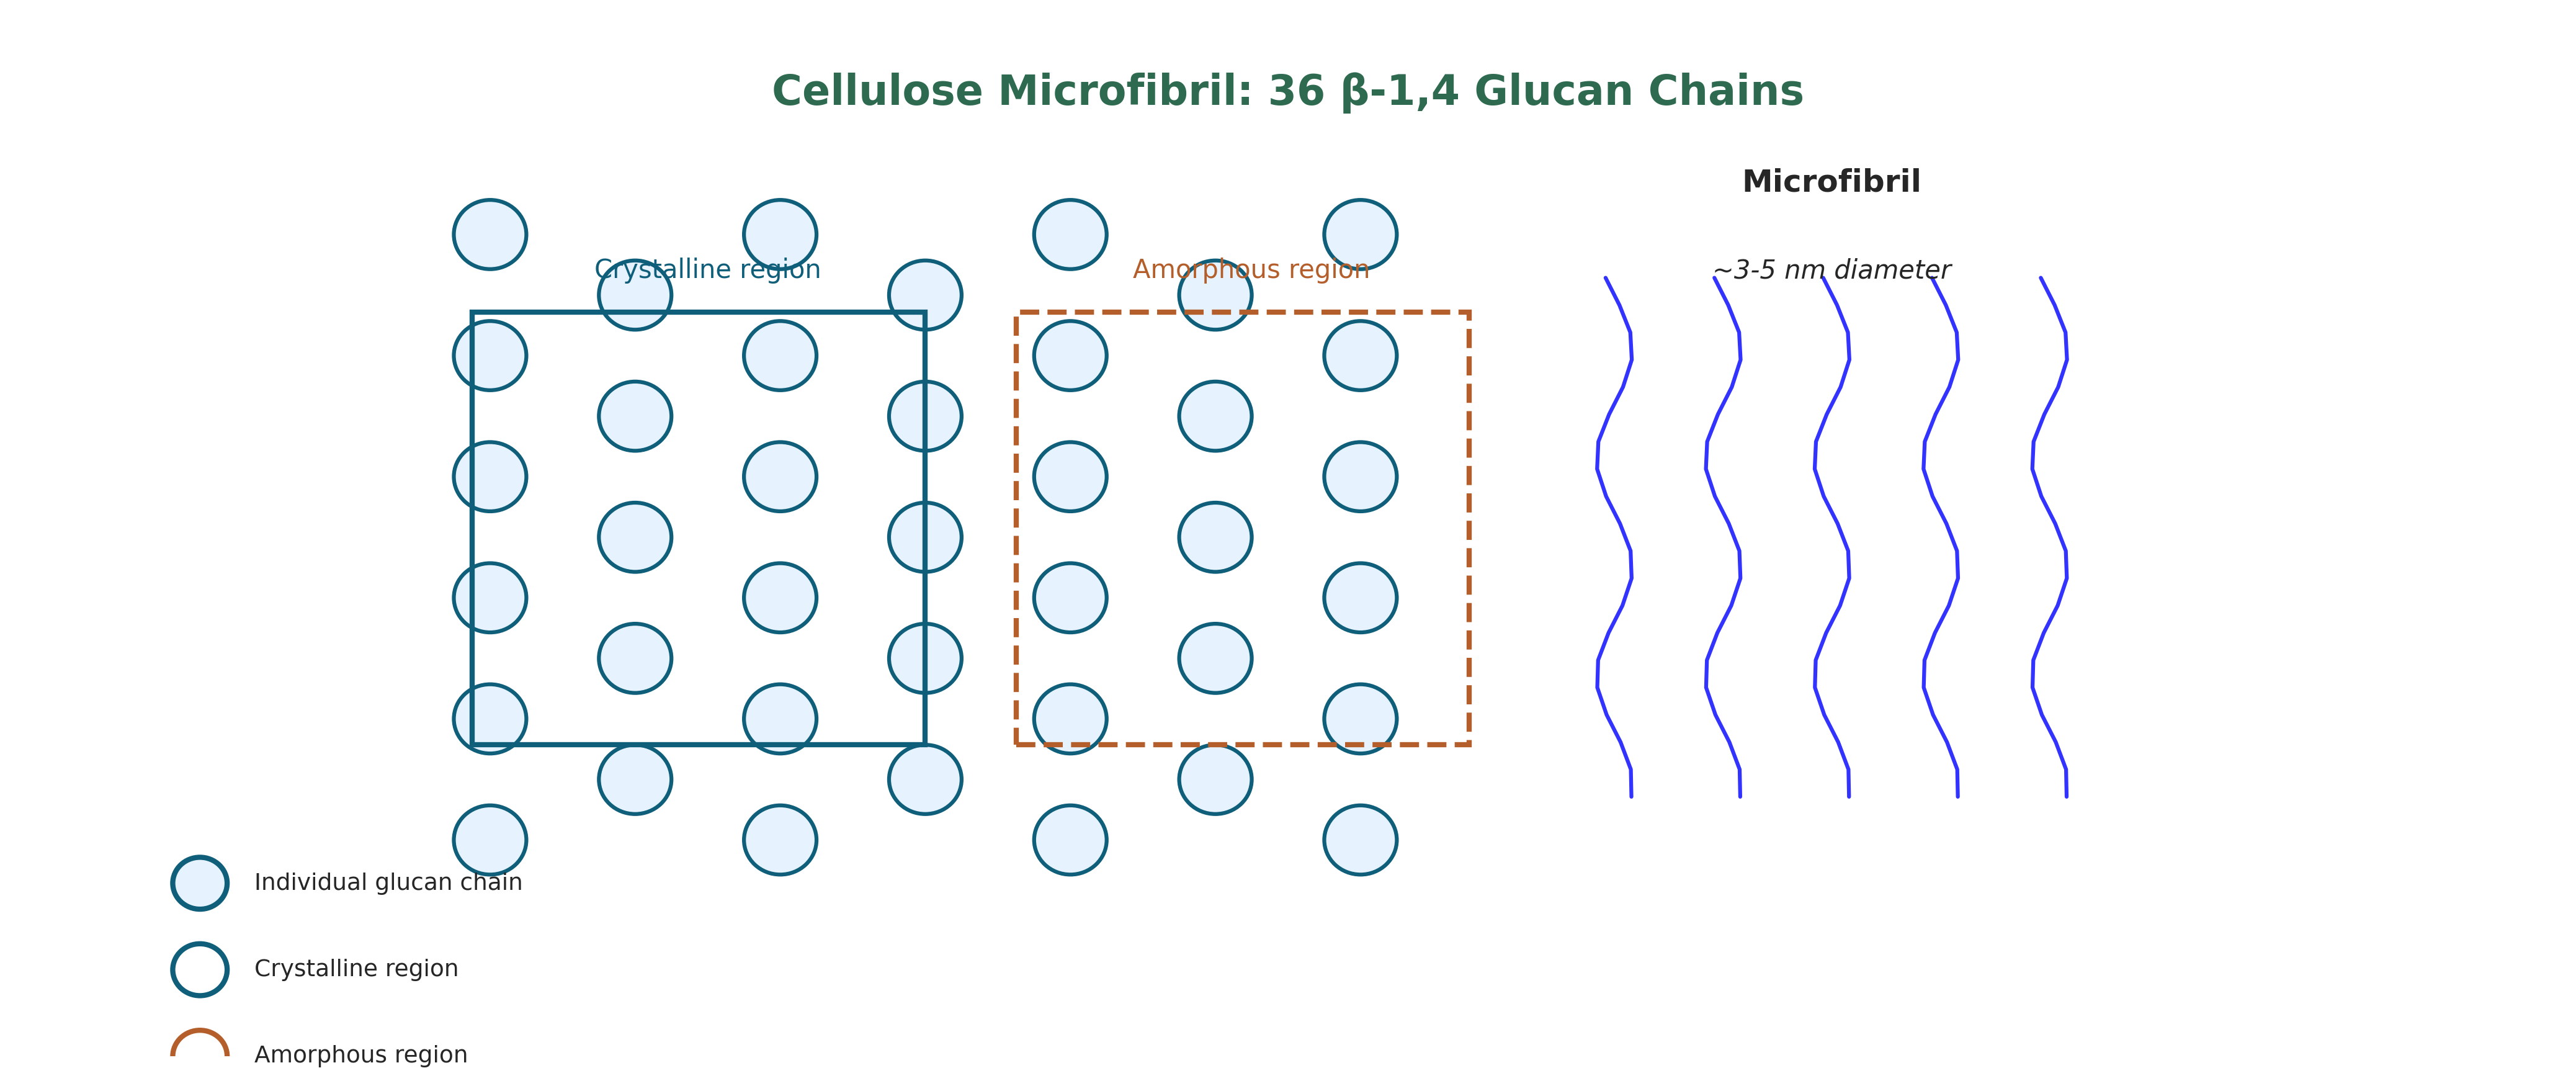
Cellulose Microfibril
36 glucan chains with crystalline regions
images/03_cellulose_microfibril.png
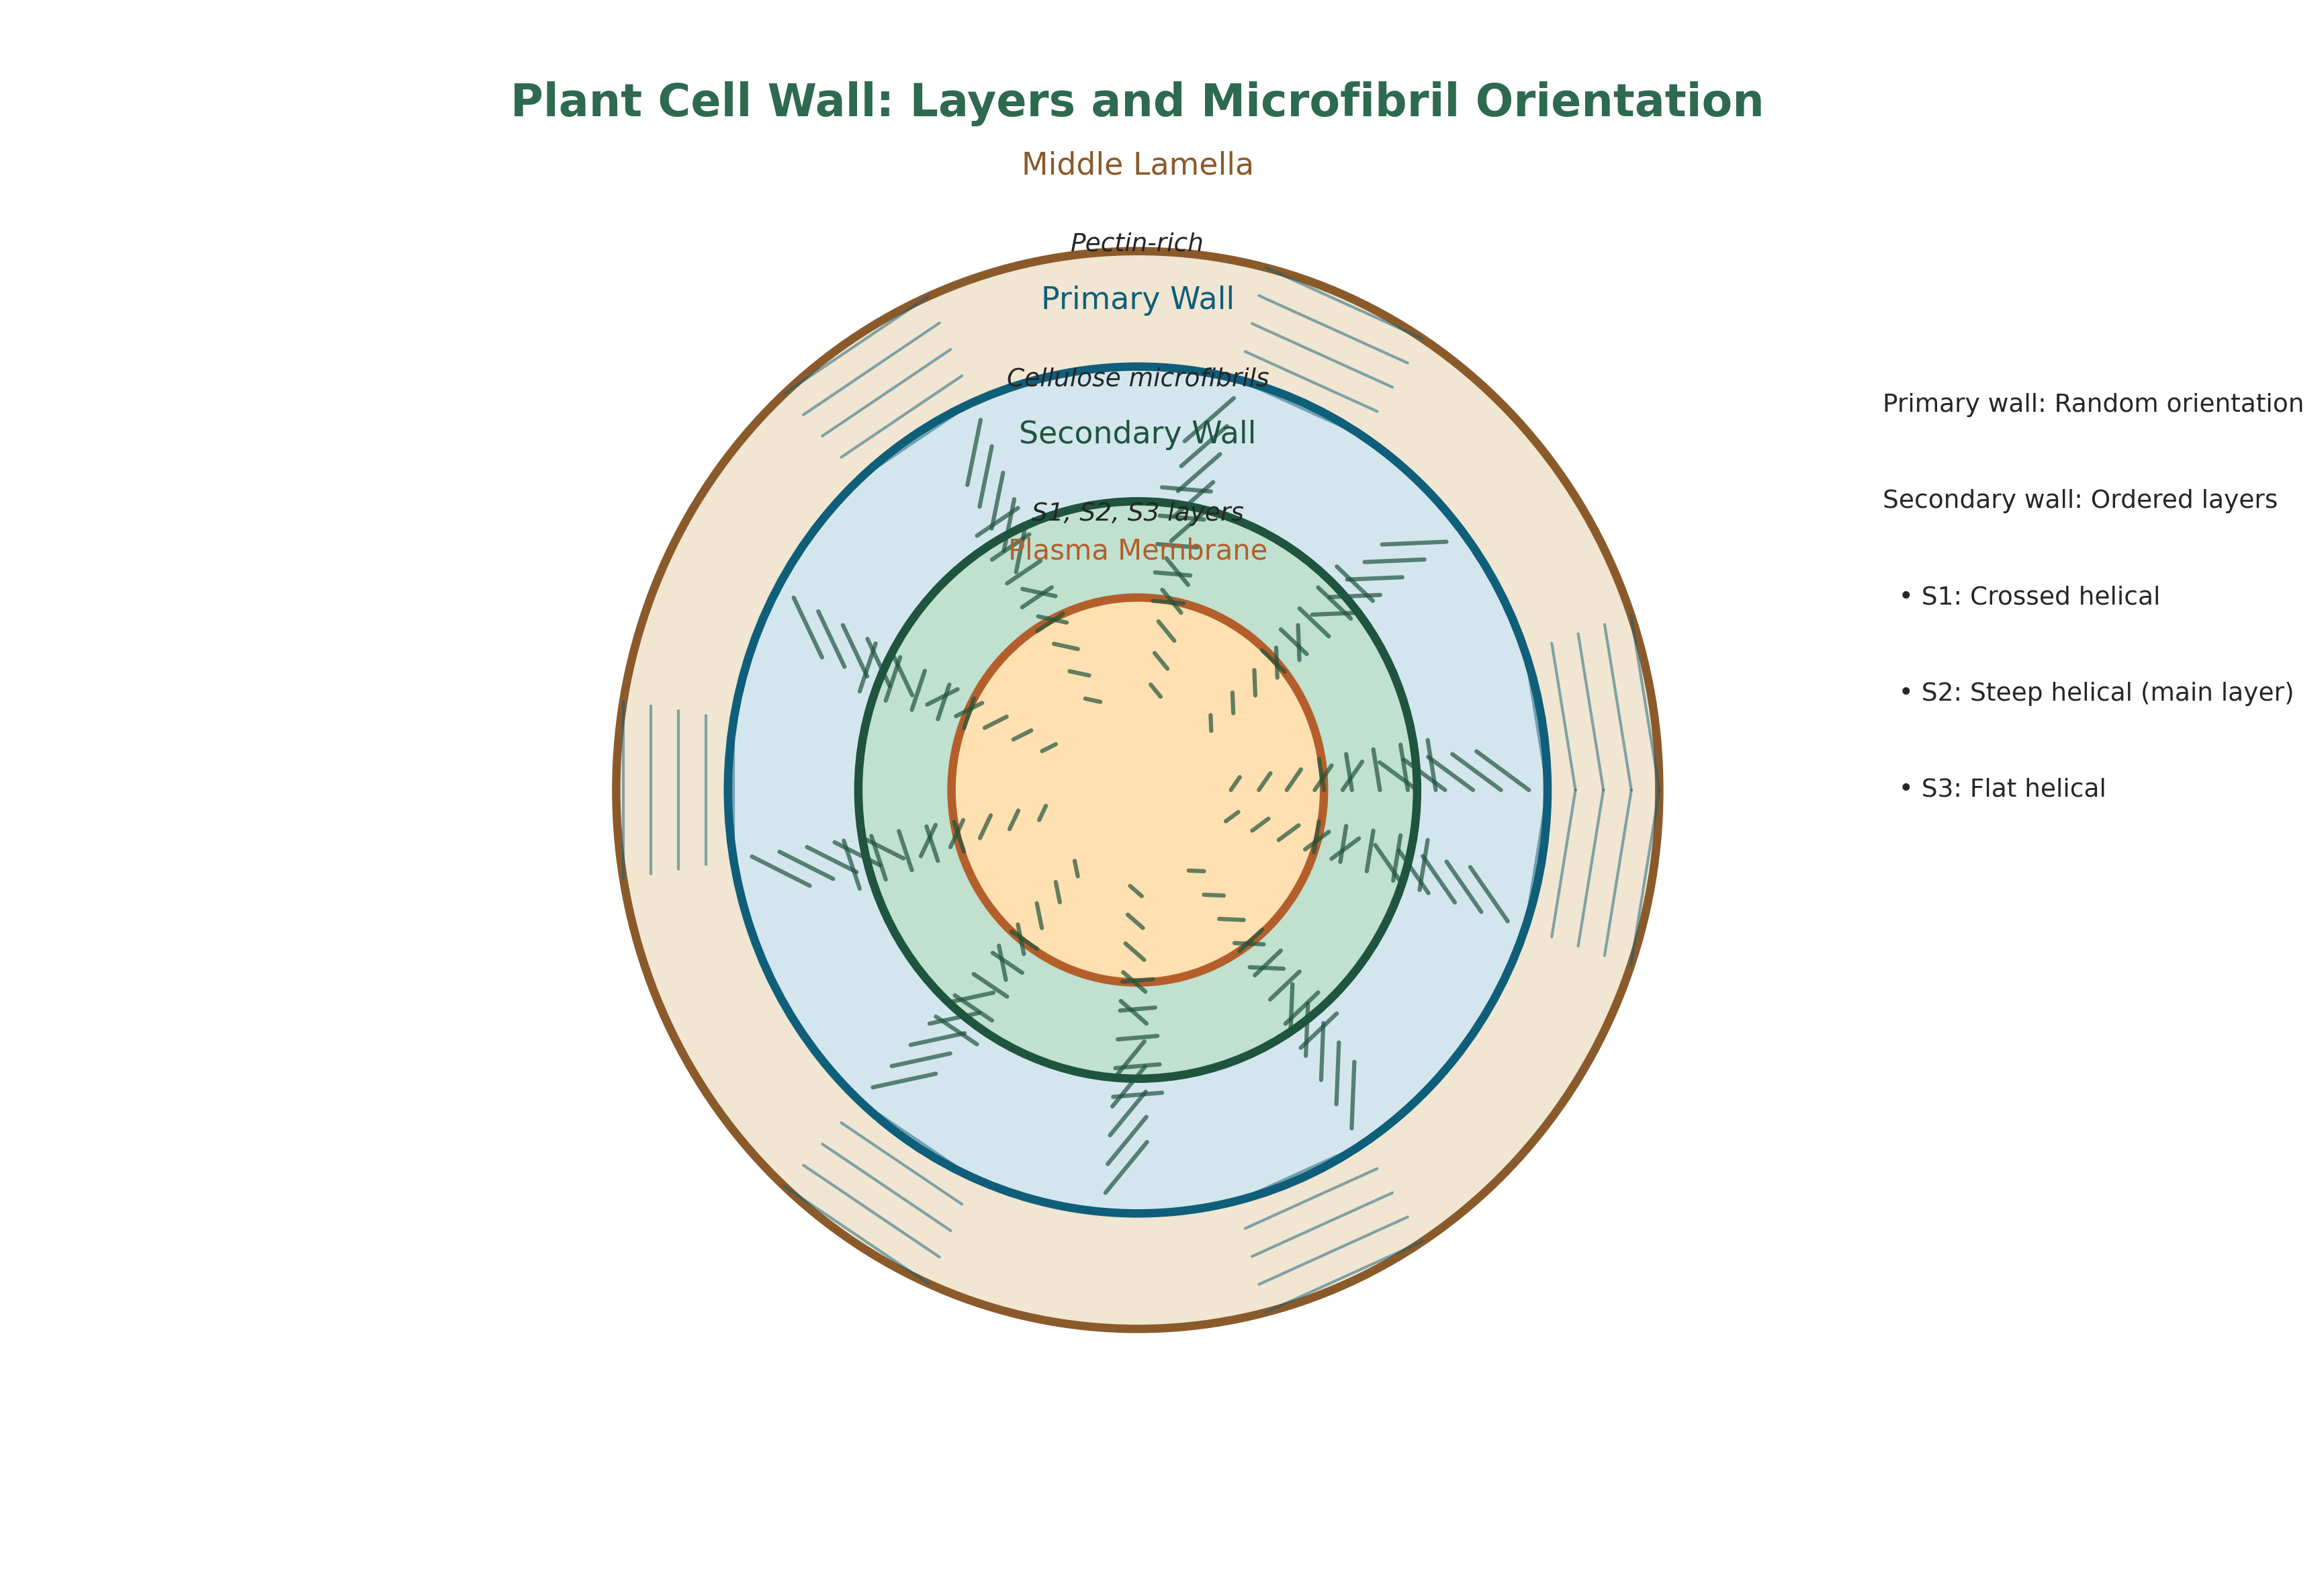
Plant Cell Wall Layers
Middle lamella, primary wall, secondary wall
images/04_cell_wall_layers.png

Saturated vs Unsaturated Fatty Acids
Straight vs kinked chains
images/01_saturated_vs_unsaturated.png
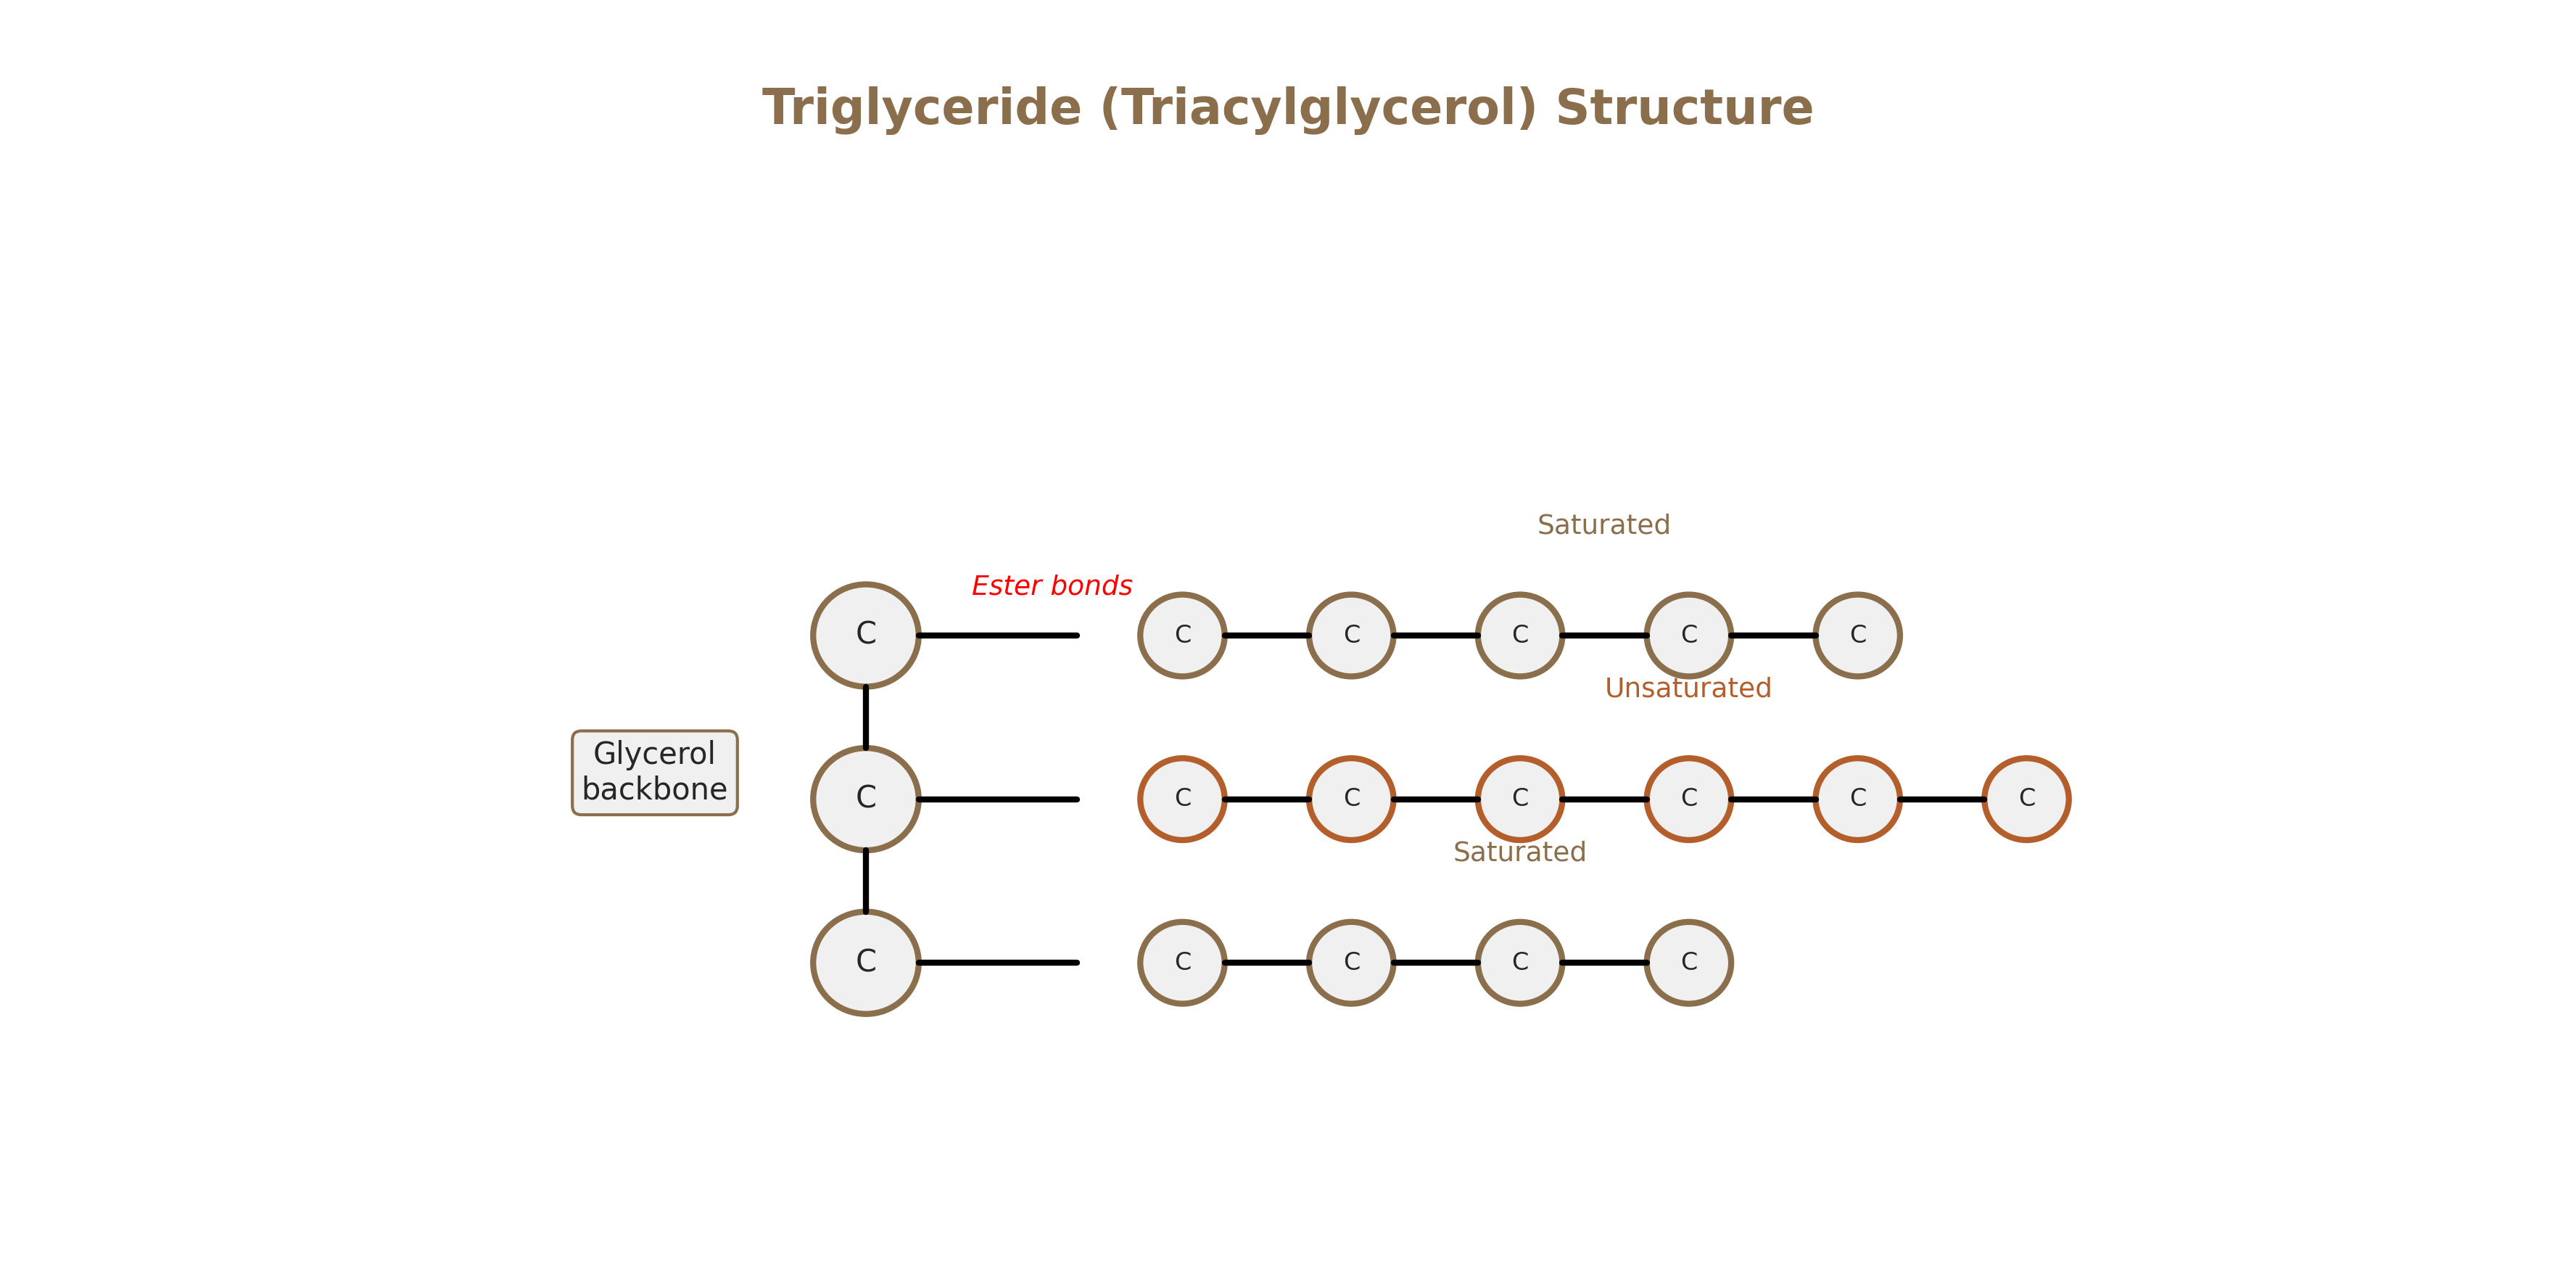
Triglyceride Structure
Glycerol + 3 fatty acids
images/02_triglyceride_structure.png

Phospholipid Bilayer
Cell membrane structure
images/03_phospholipid_bilayer.png

Plant Cuticle Structure
Epicuticular wax, cutin, cell wall
images/04_plant_cuticle.png

β-Carotene Structure
Conjugated double bonds
images/05_carotenoid_structure.png

Cell Membrane with Proteins
Fluid mosaic model
images/06_membrane_proteins.png

Oil Bodies in Seeds
Lipid droplets with oleosin proteins
images/07_oil_bodies.png

Fatty Acid Comparison Table
Properties of saturated and unsaturated
images/08_fatty_acid_comparison.png

Lipids in Horticulture
Fruit coatings, oils, anti-transpirants
images/09_horticultural_applications.png

Ethiopian Niger Seed (Nug)
Oilseed crop, fatty acid profile
images/10_niger_seed.png

General Amino Acid Structure
Central carbon, amino group, carboxyl, R group
images/01_amino_acid_general.png
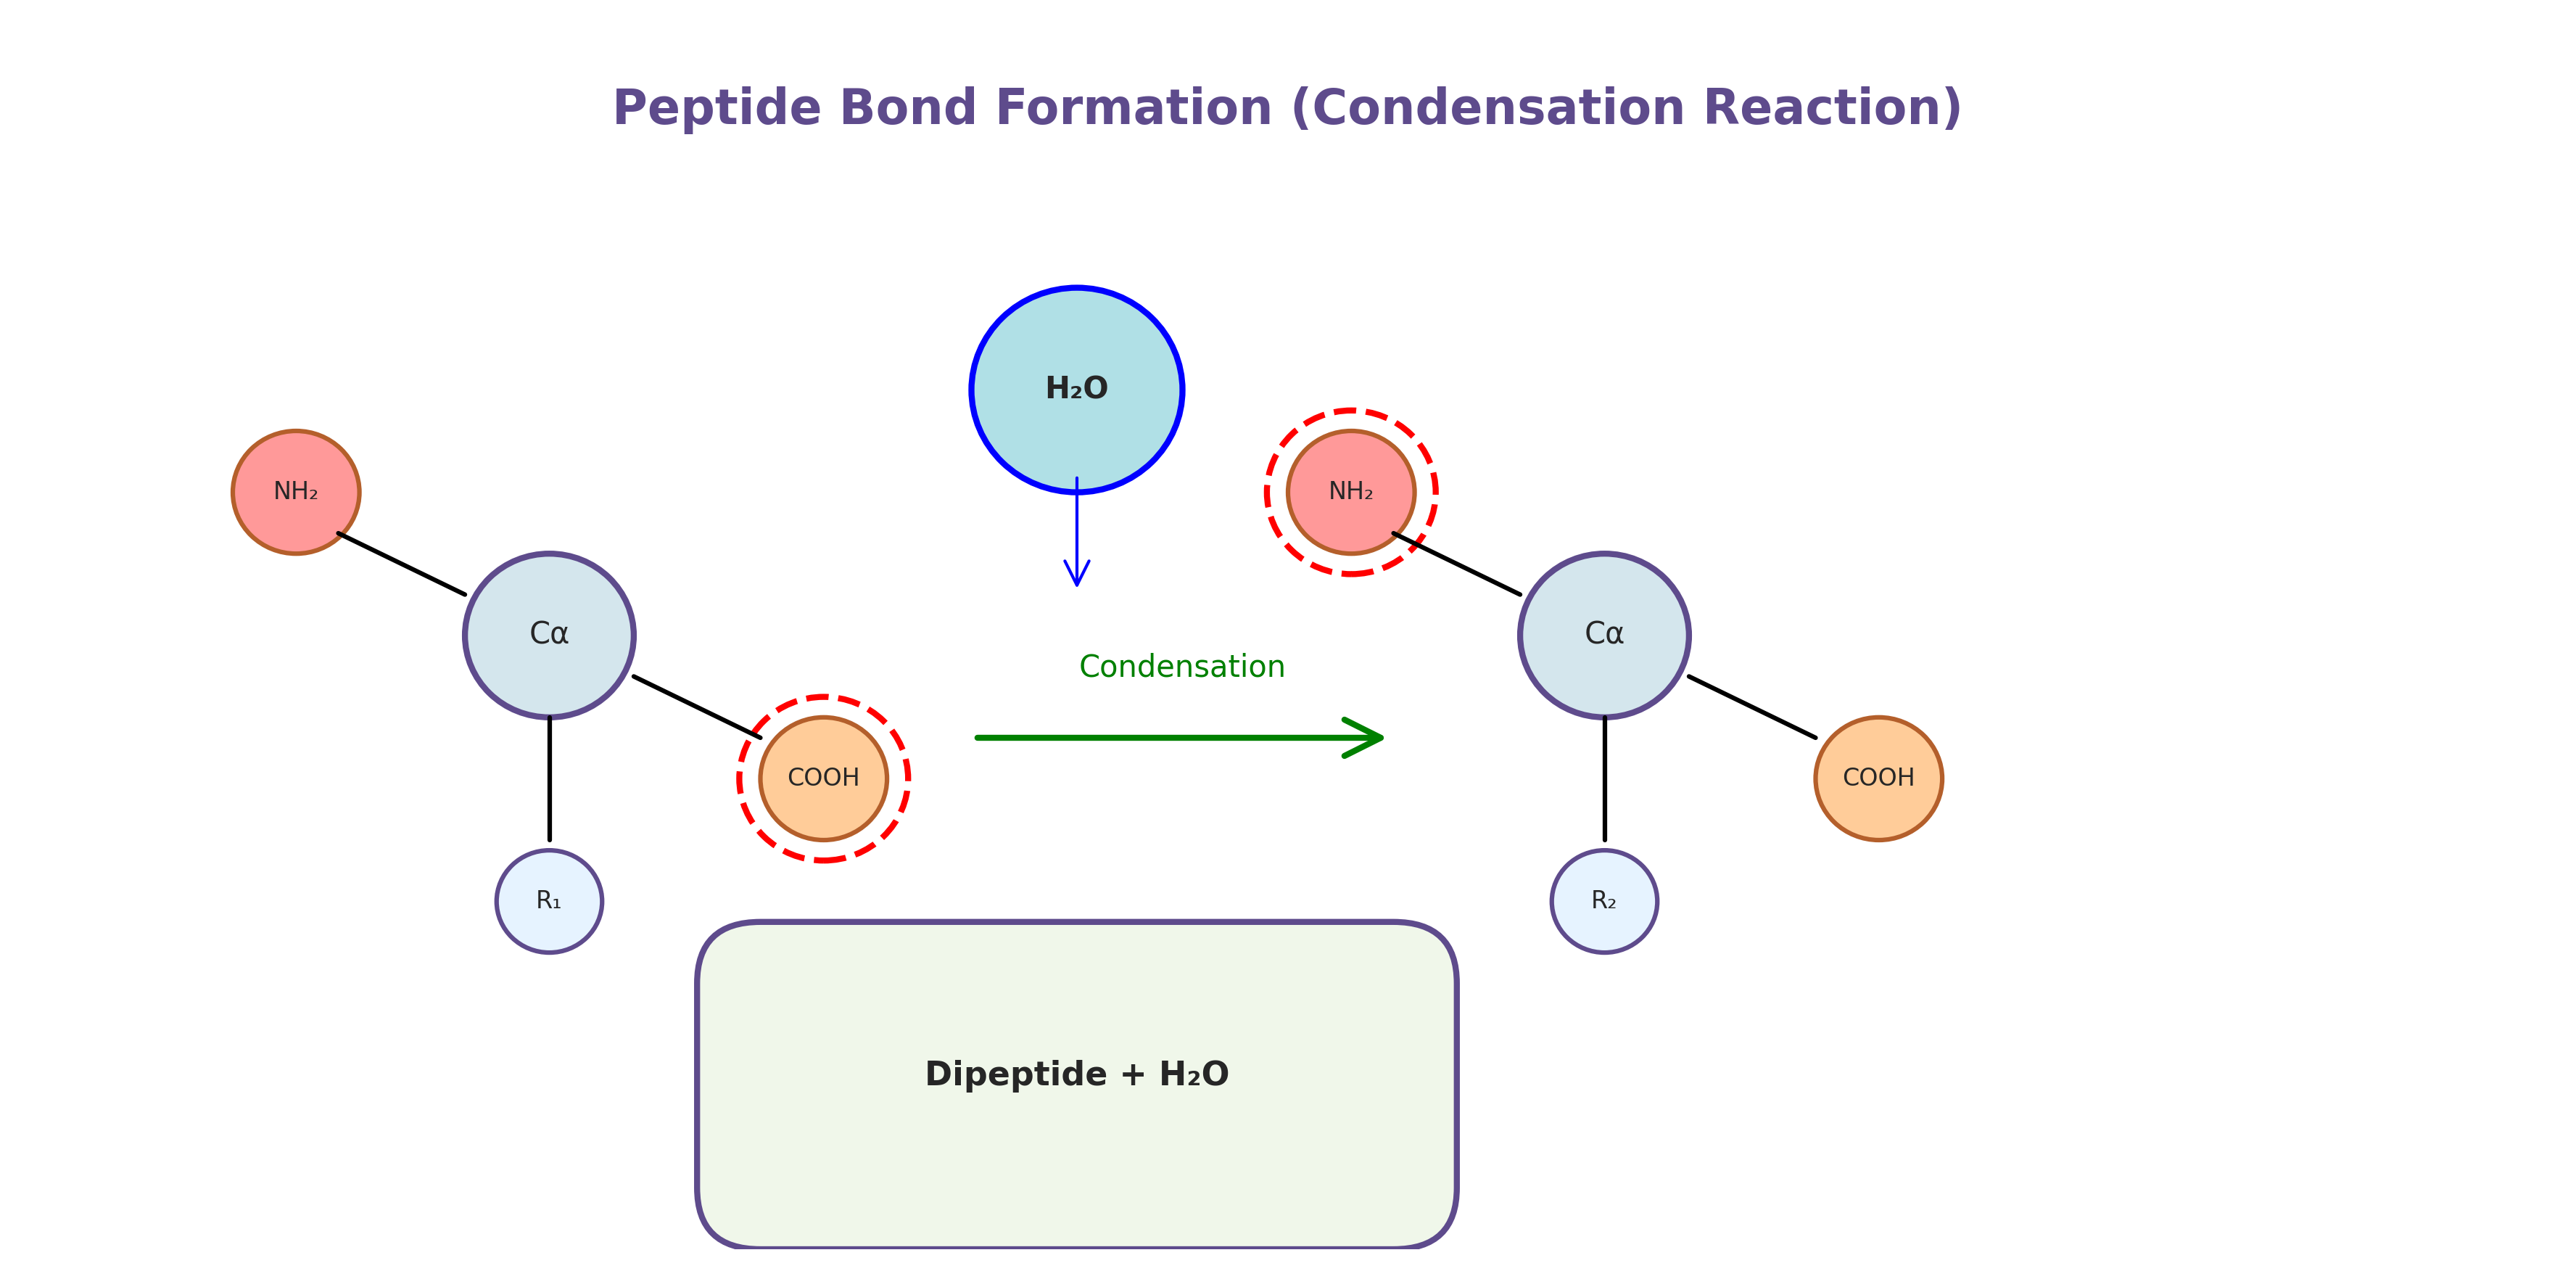
Peptide Bond Formation
Condensation reaction releasing water
images/02_peptide_bond_formation.png
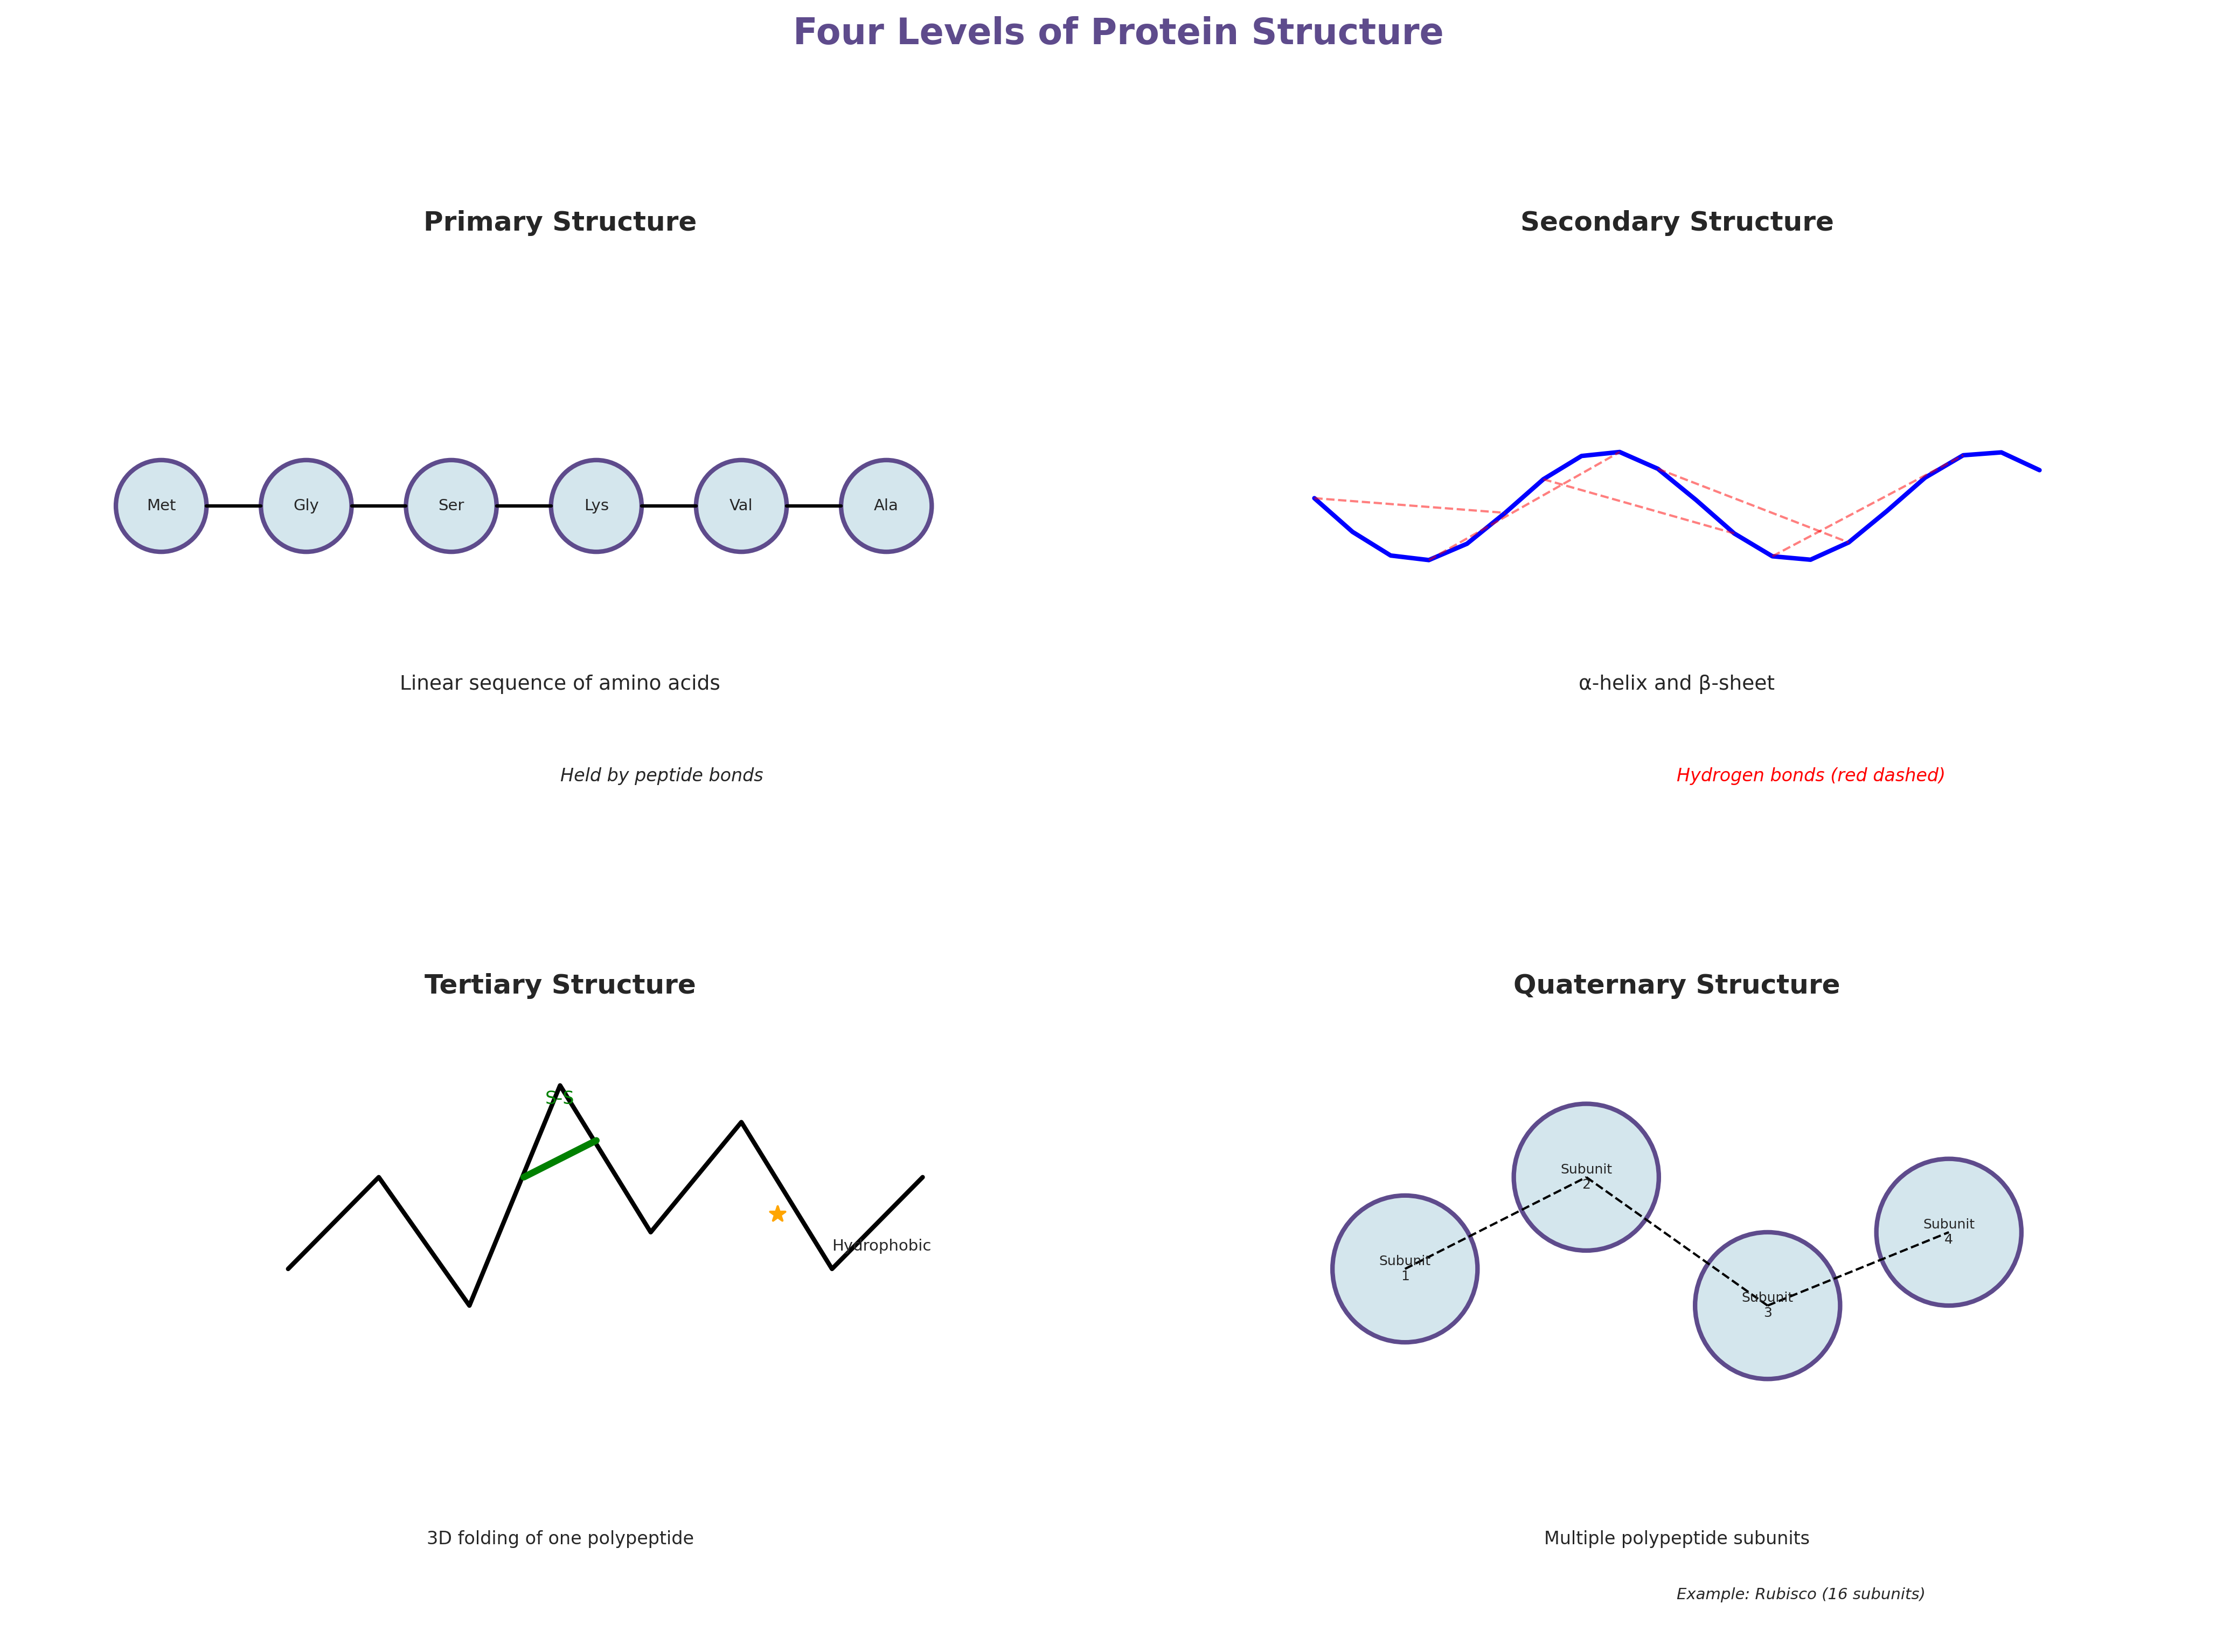
Four Levels of Protein Structure
Primary to quaternary organization
images/03_protein_structure_levels.png

Enzyme Active Site
Substrate binding and specificity
images/04_enzyme_active_site.png
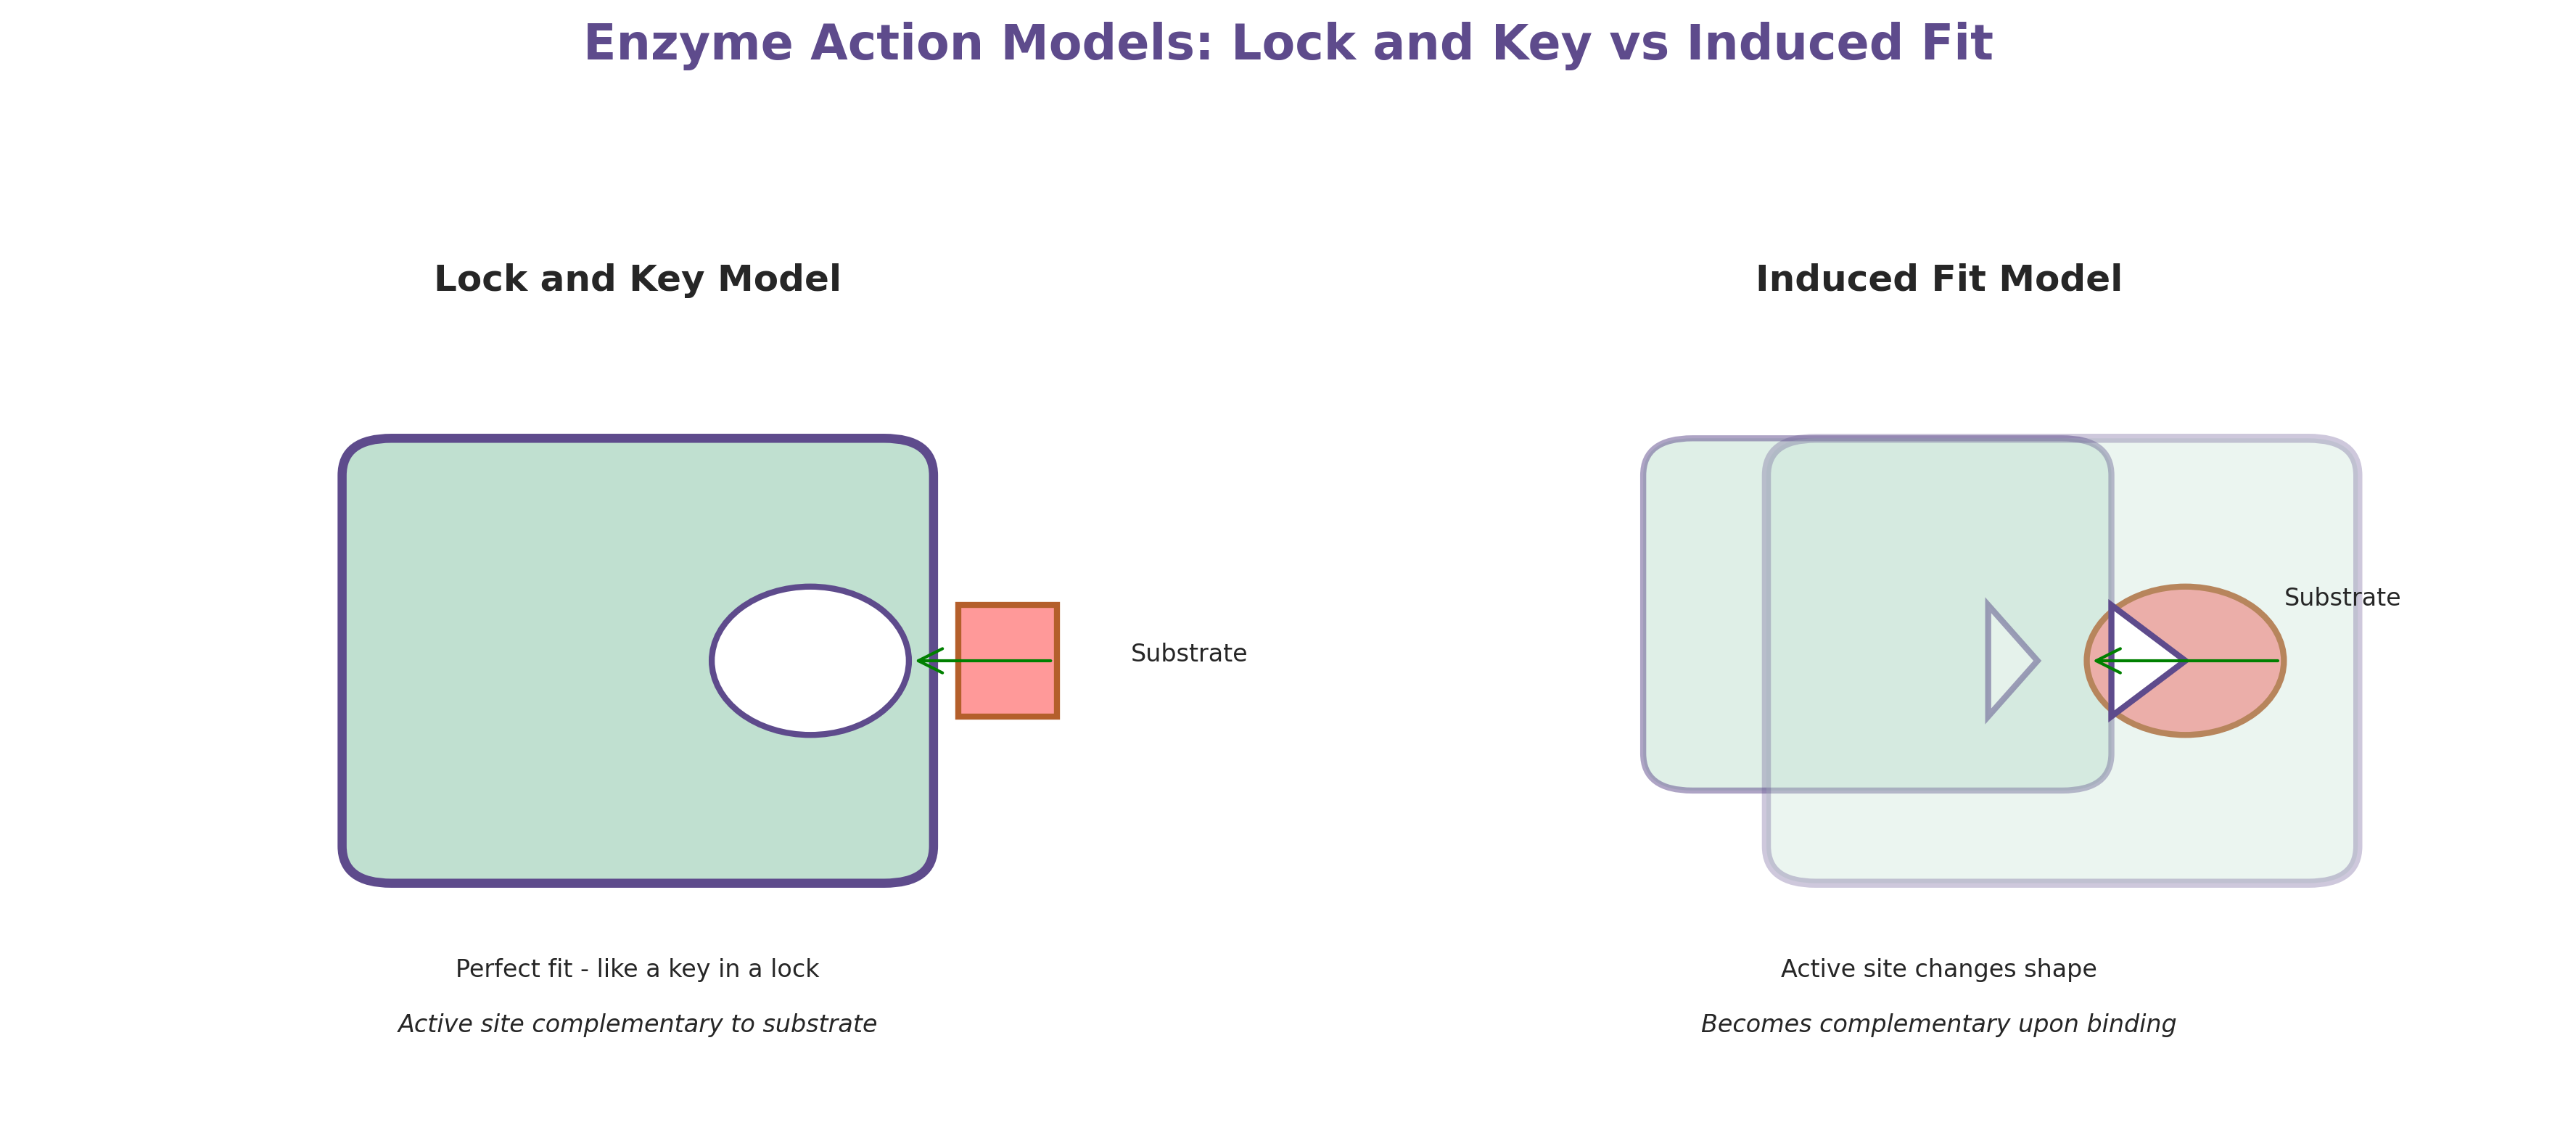
Enzyme Action Models
Lock and key vs induced fit
images/05_lock_key_vs_induced_fit.png

Activation Energy Graph
Enzymes lower energy barrier
images/06_activation_energy.png

Factors Affecting Enzyme Activity
Temperature, pH, [S], [E]
images/07_factors_affecting_enzymes.png

Types of Enzyme Inhibition
Competitive, non-competitive, uncompetitive
images/08_enzyme_inhibition.png

Enzyme Kinetics Plots
Michaelis-Menten and Lineweaver-Burk
images/09_enzyme_kinetics.png

Enzymatic Browning (PPO)
Polyphenol oxidase reaction
images/10_fruit_browning.png
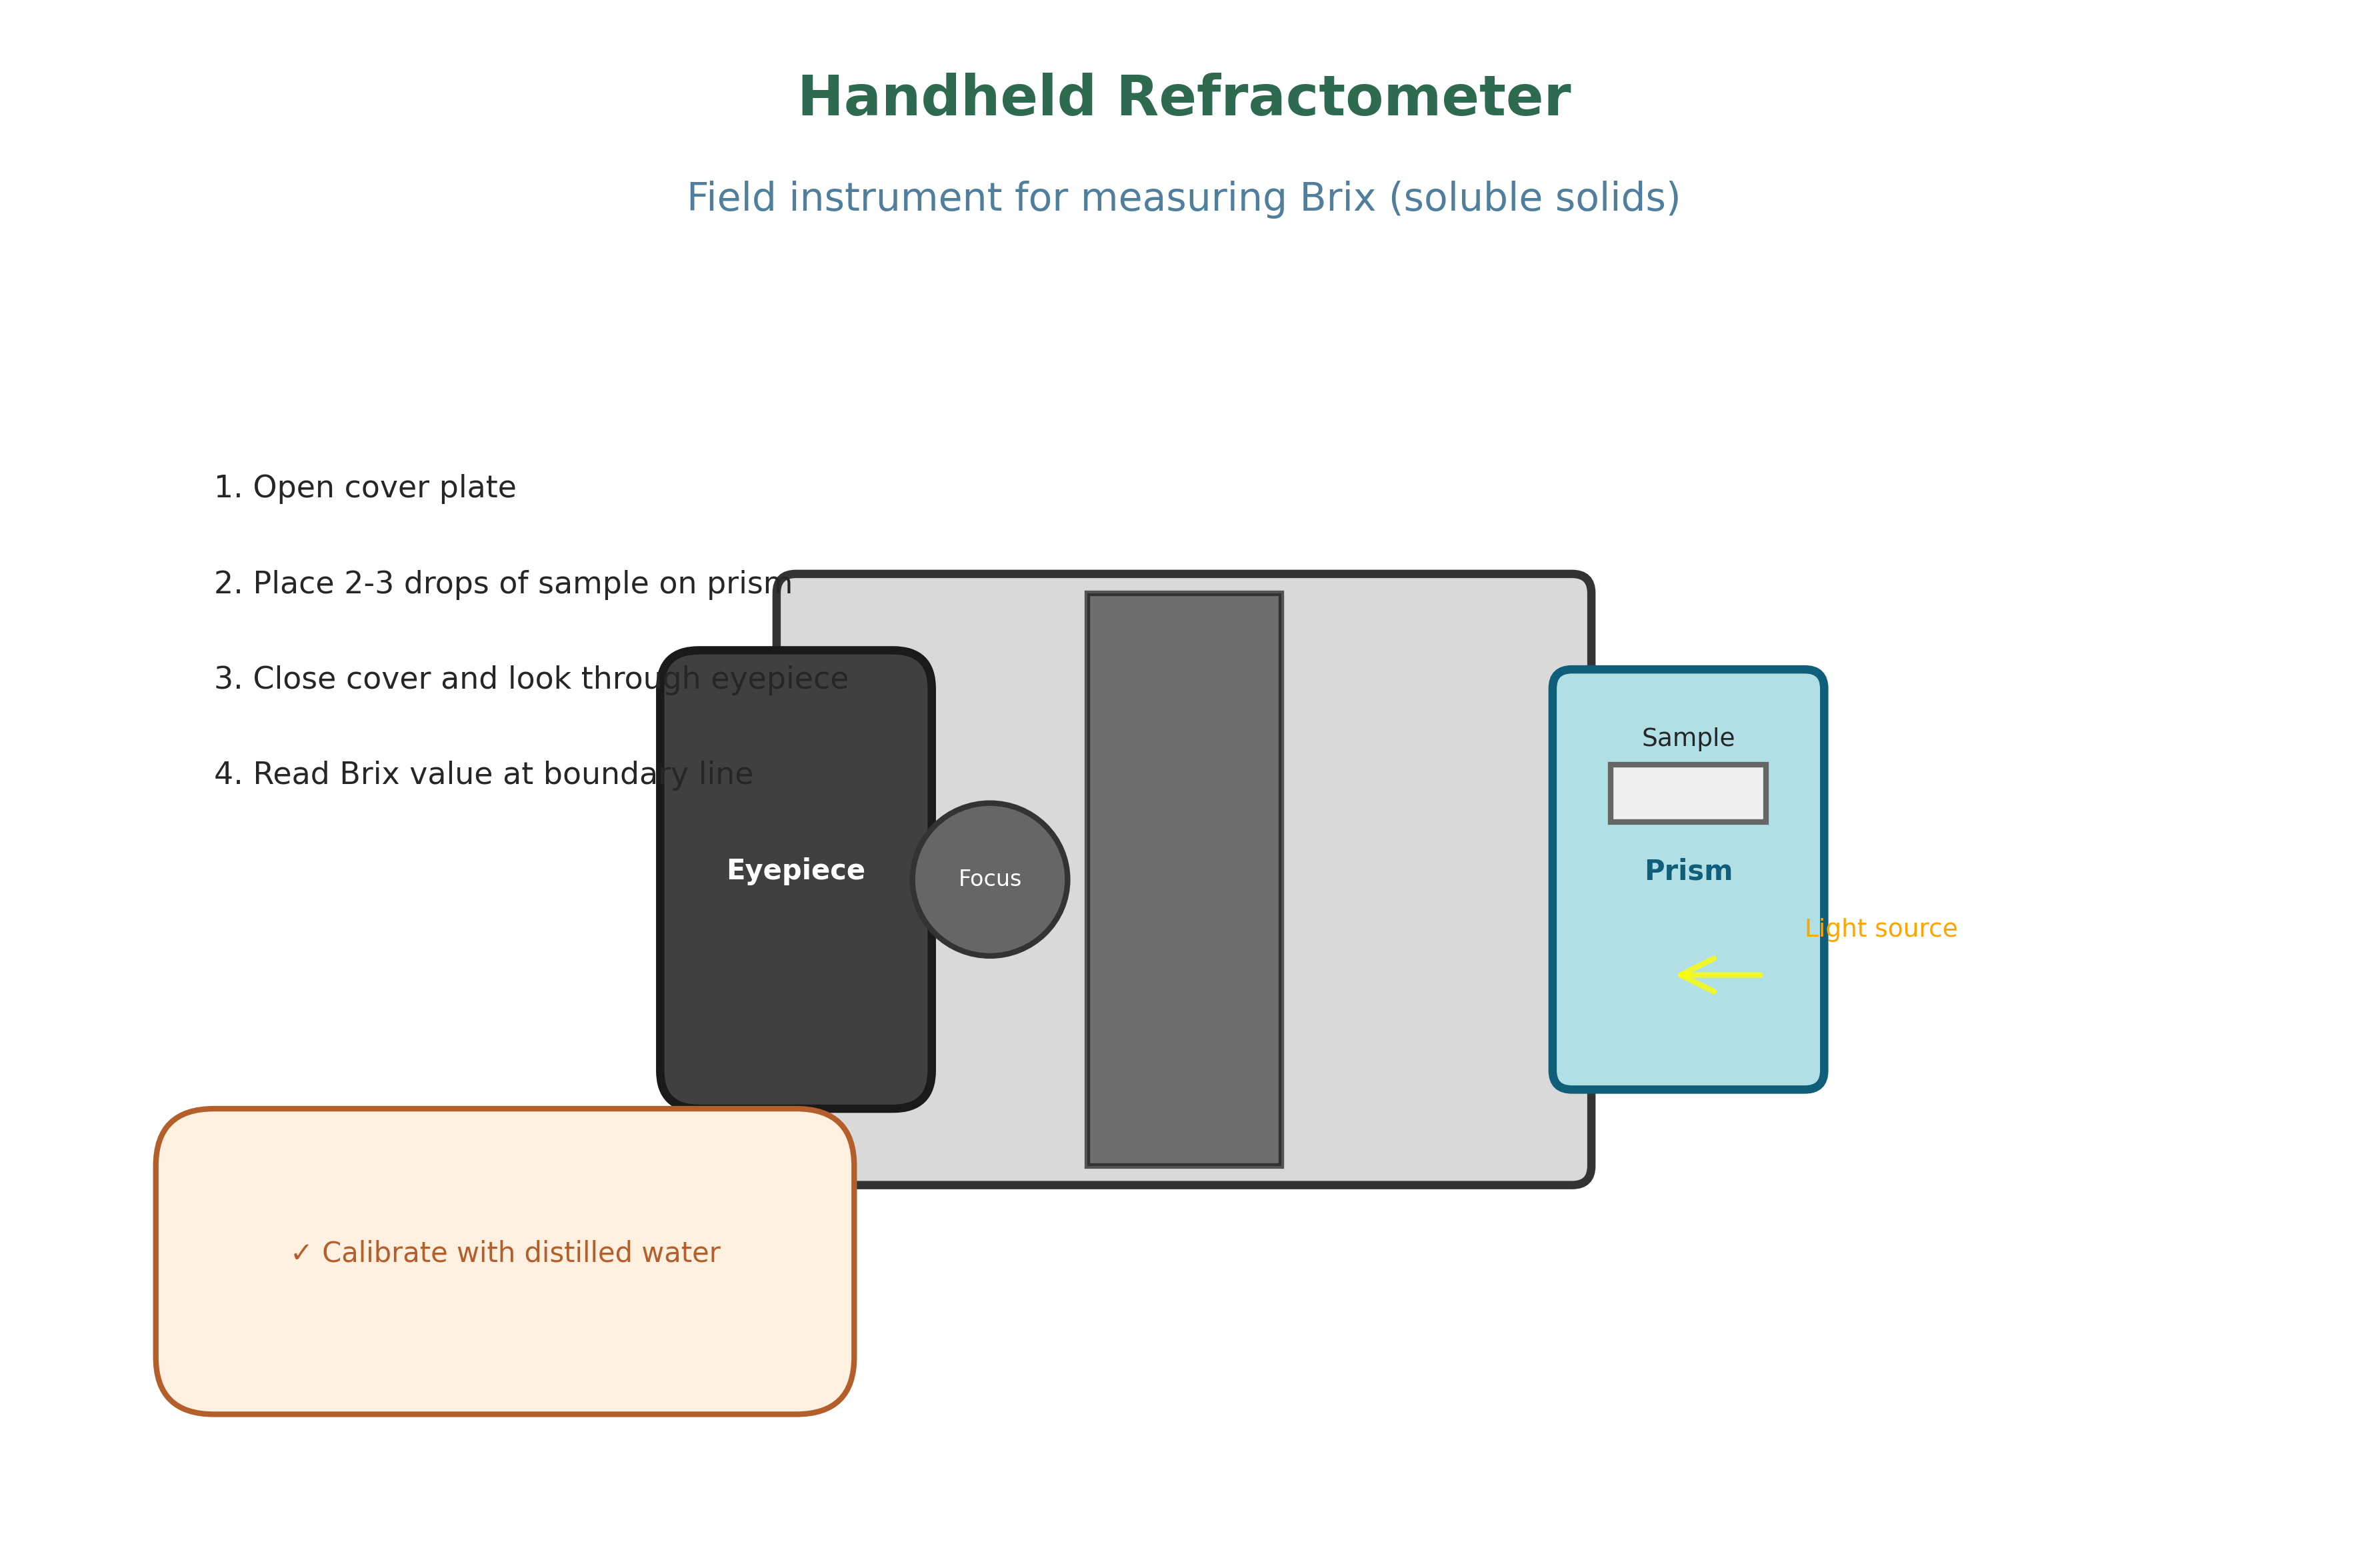
Handheld Refractometer
External view with labeled parts
images/01_refractometer_external.png
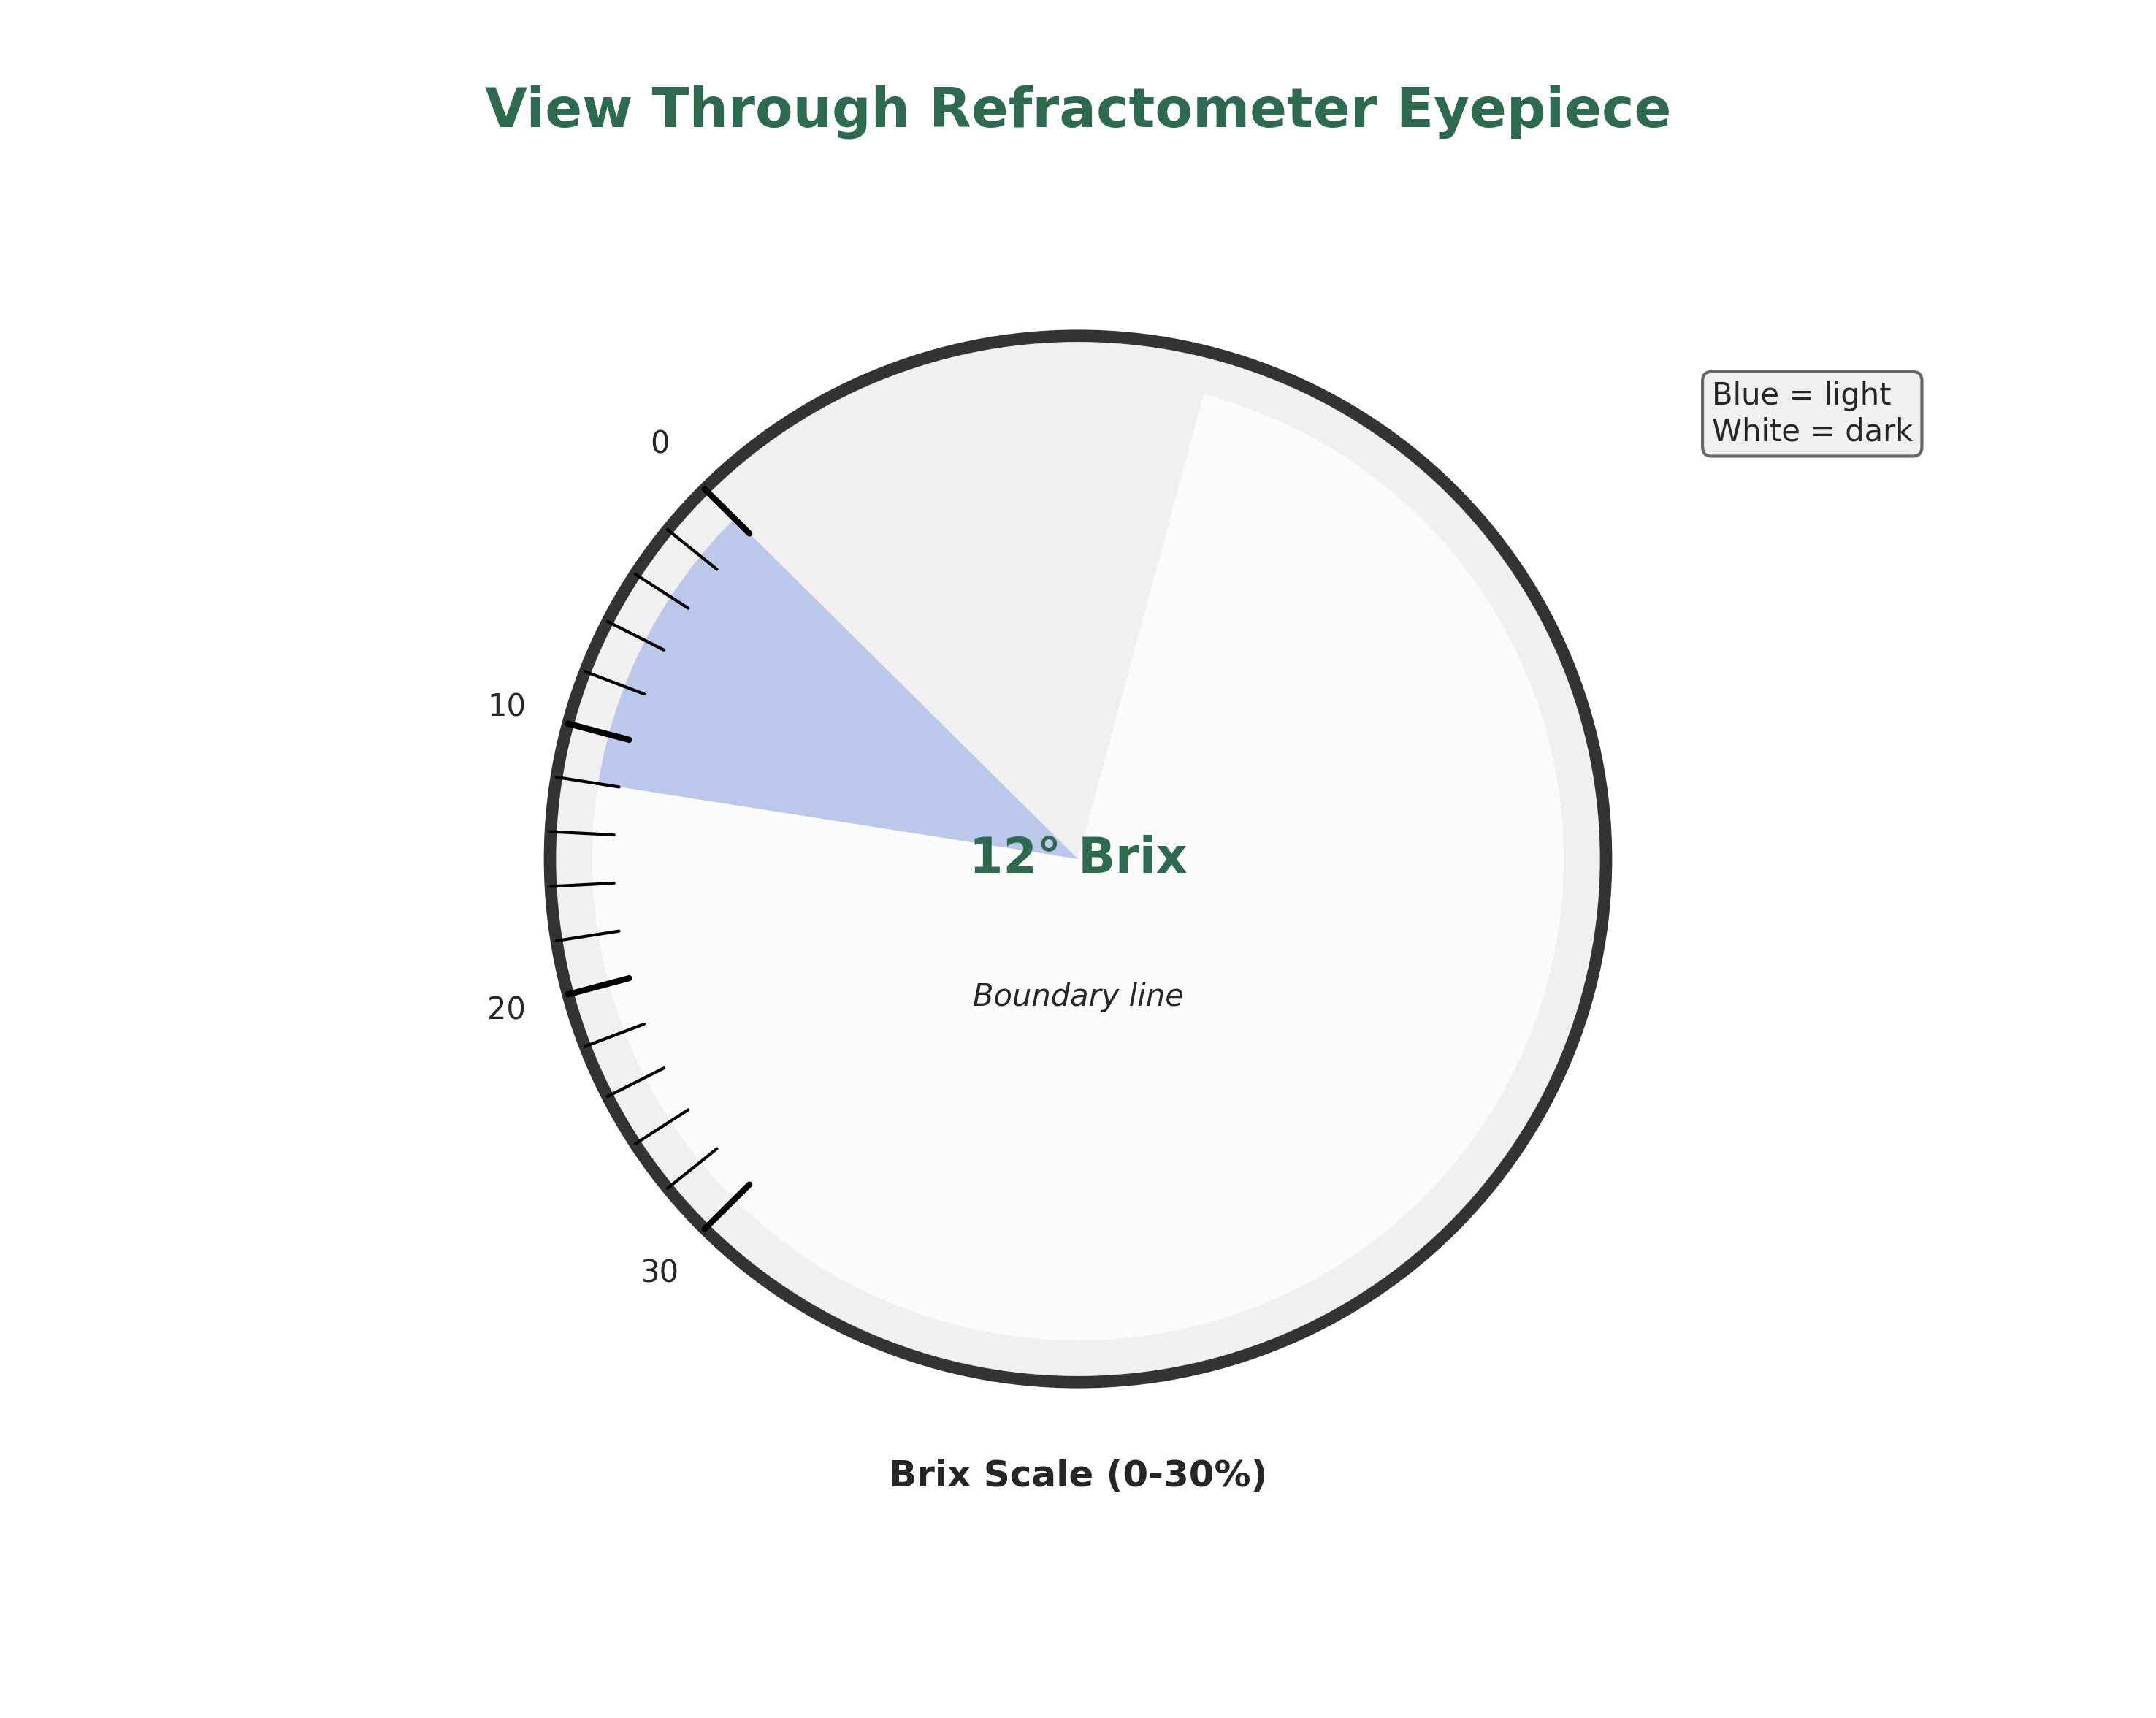
Refractometer Eyepiece View
Reading Brix at boundary line
images/02_refractometer_view.png
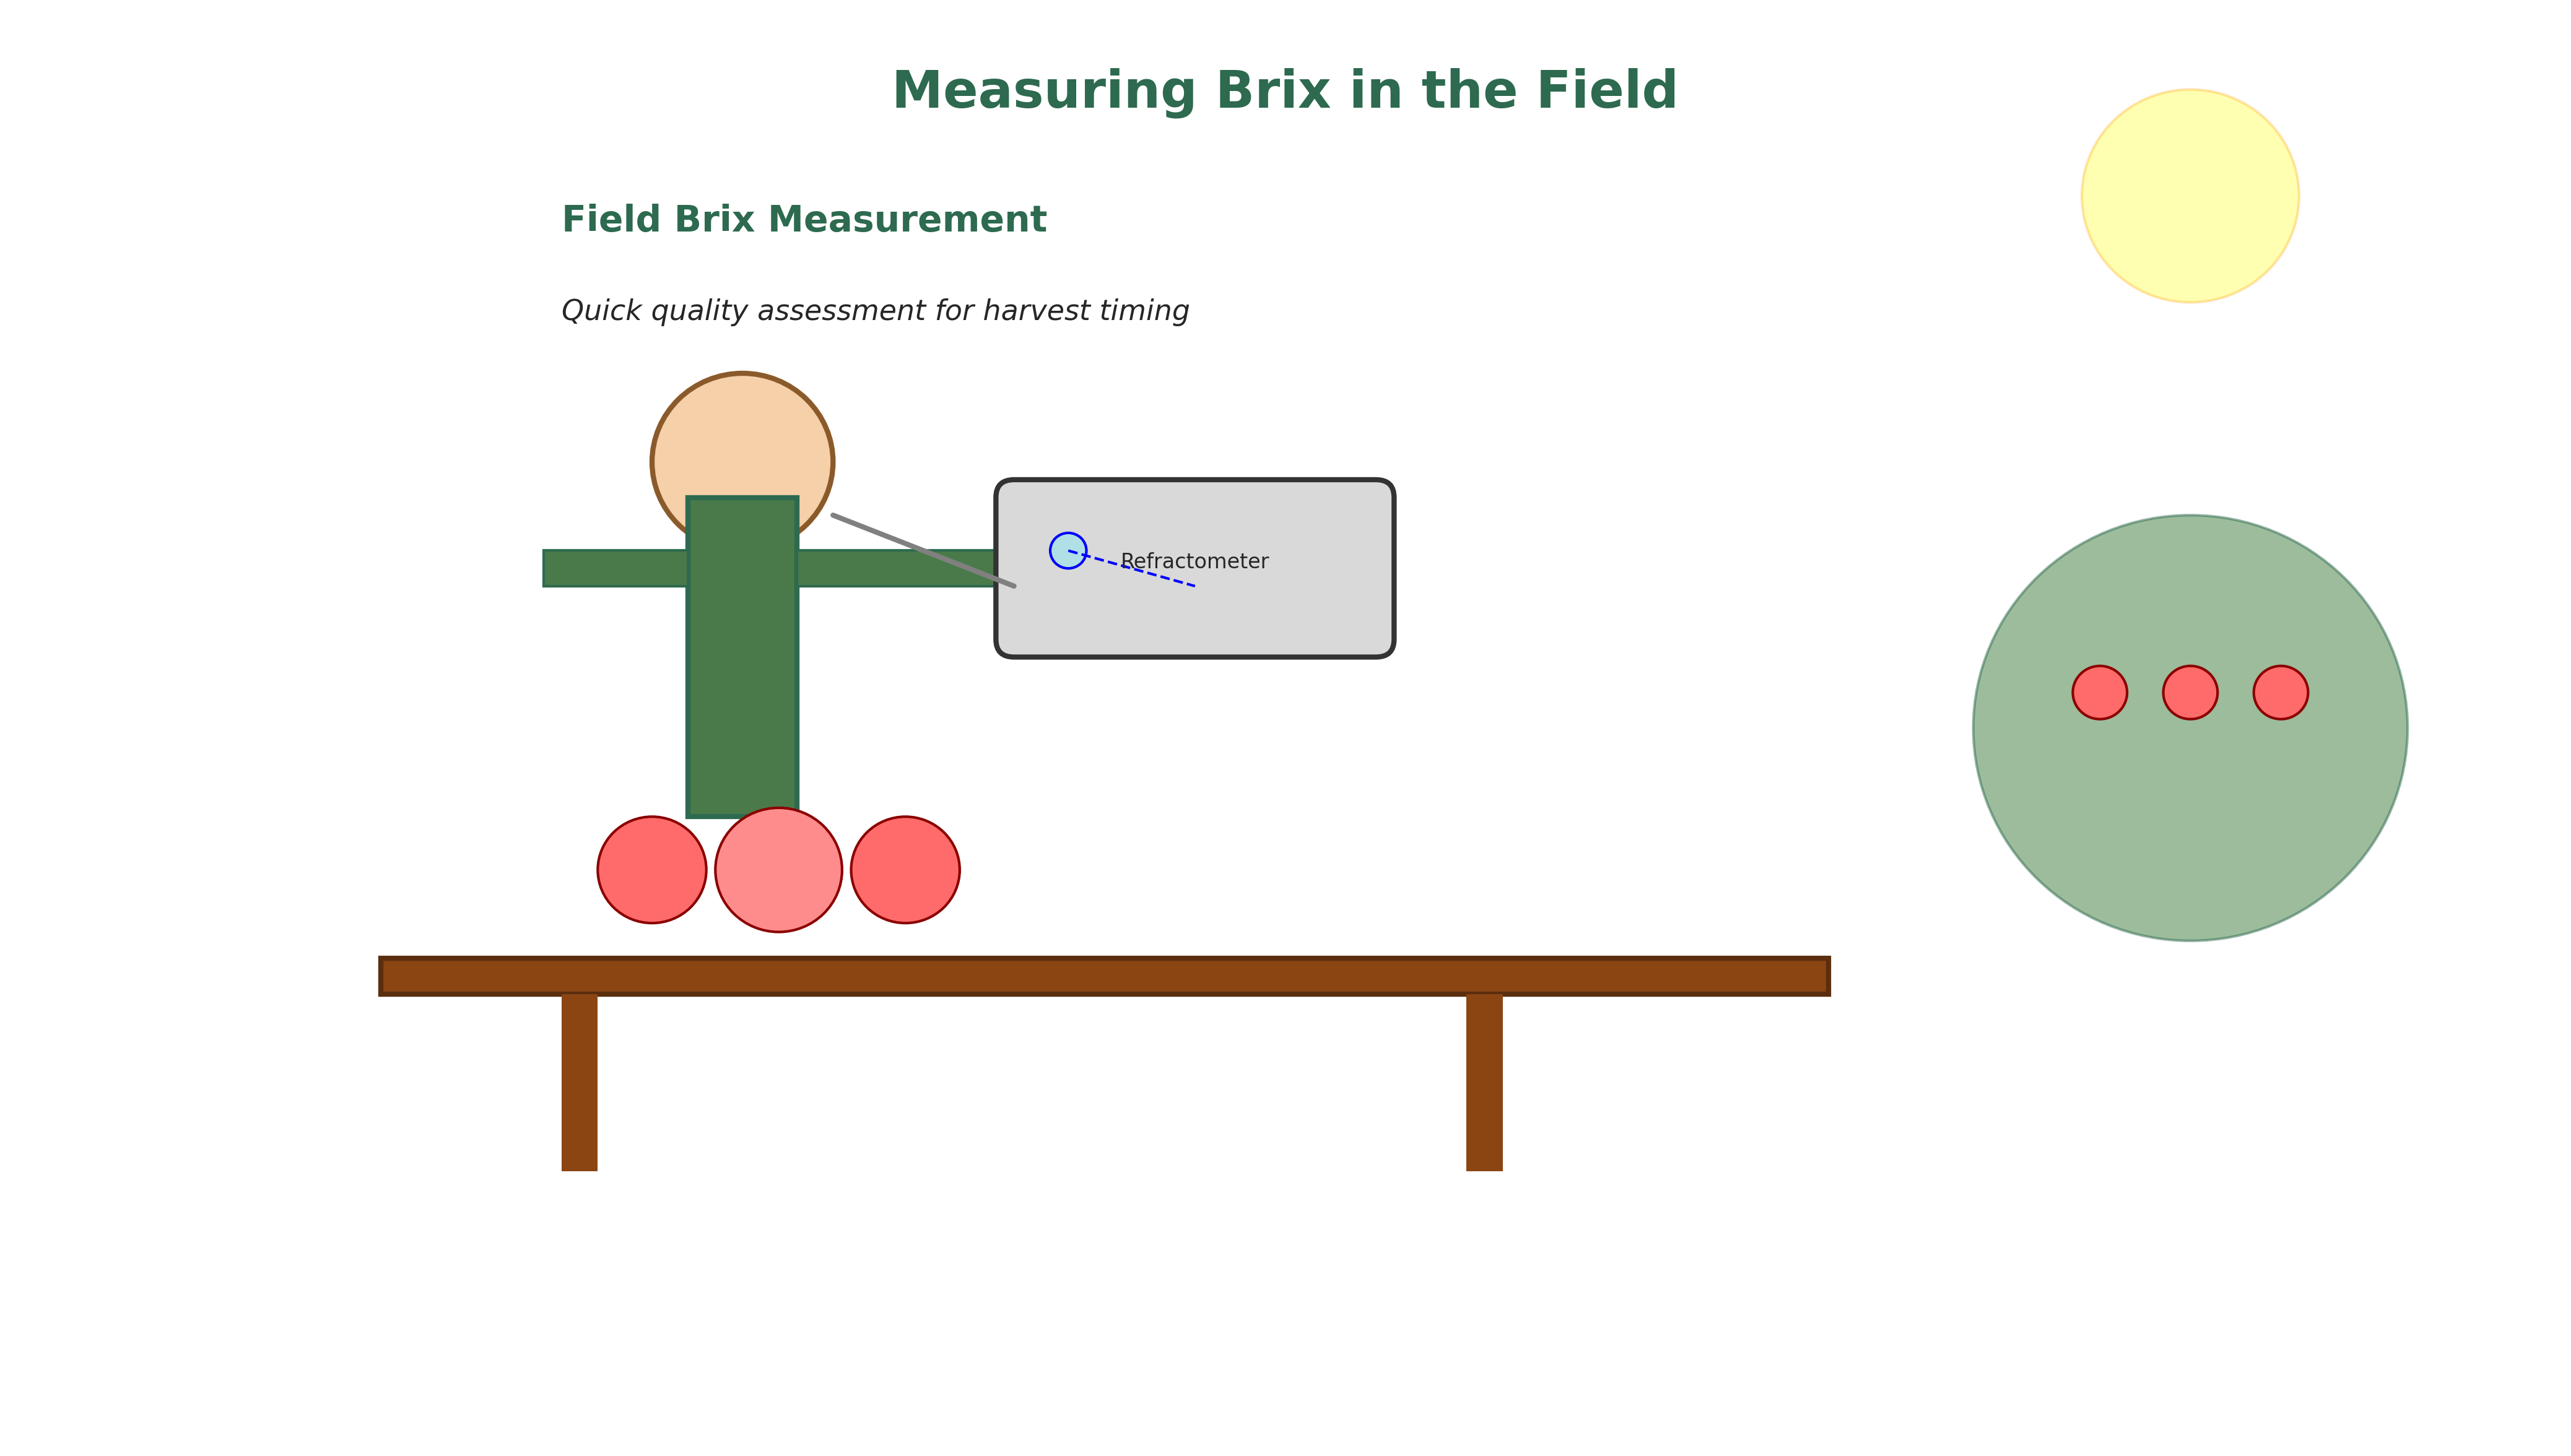
Field Brix Measurement
Farmer using refractometer in orchard
images/03_refractometer_field_use.png
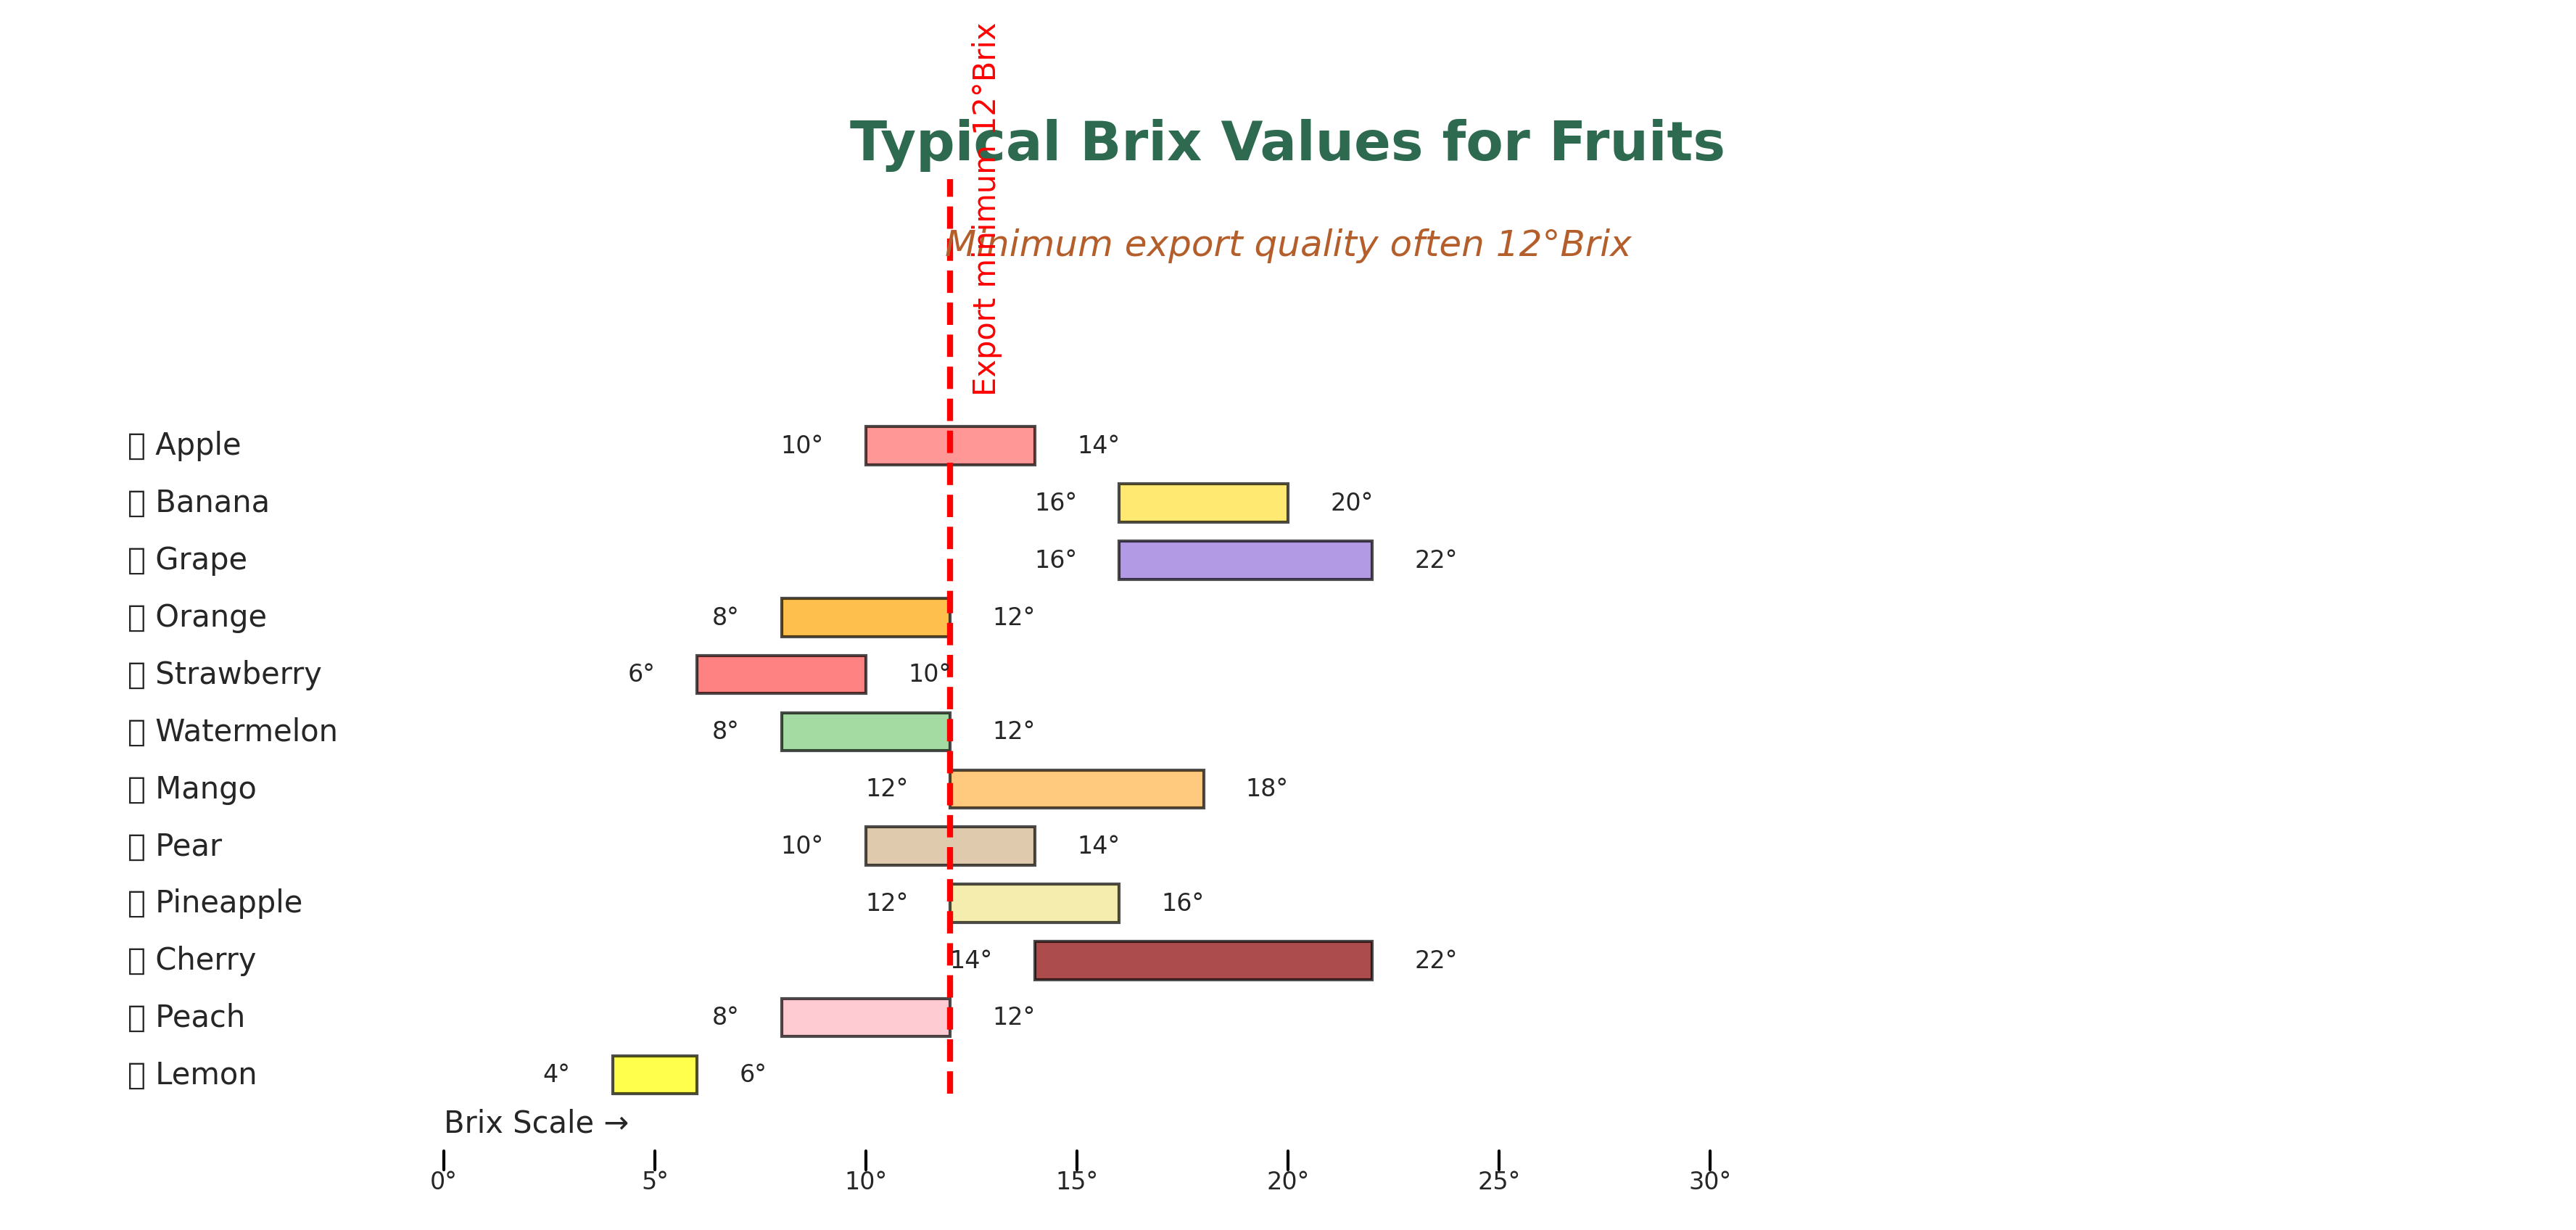
Brix Values for Fruits
Typical ranges and export threshold
images/05_brix_values.png

Starch to Sugar Conversion
Changes during climacteric ripening
images/01_starch_sugar_conversion.png
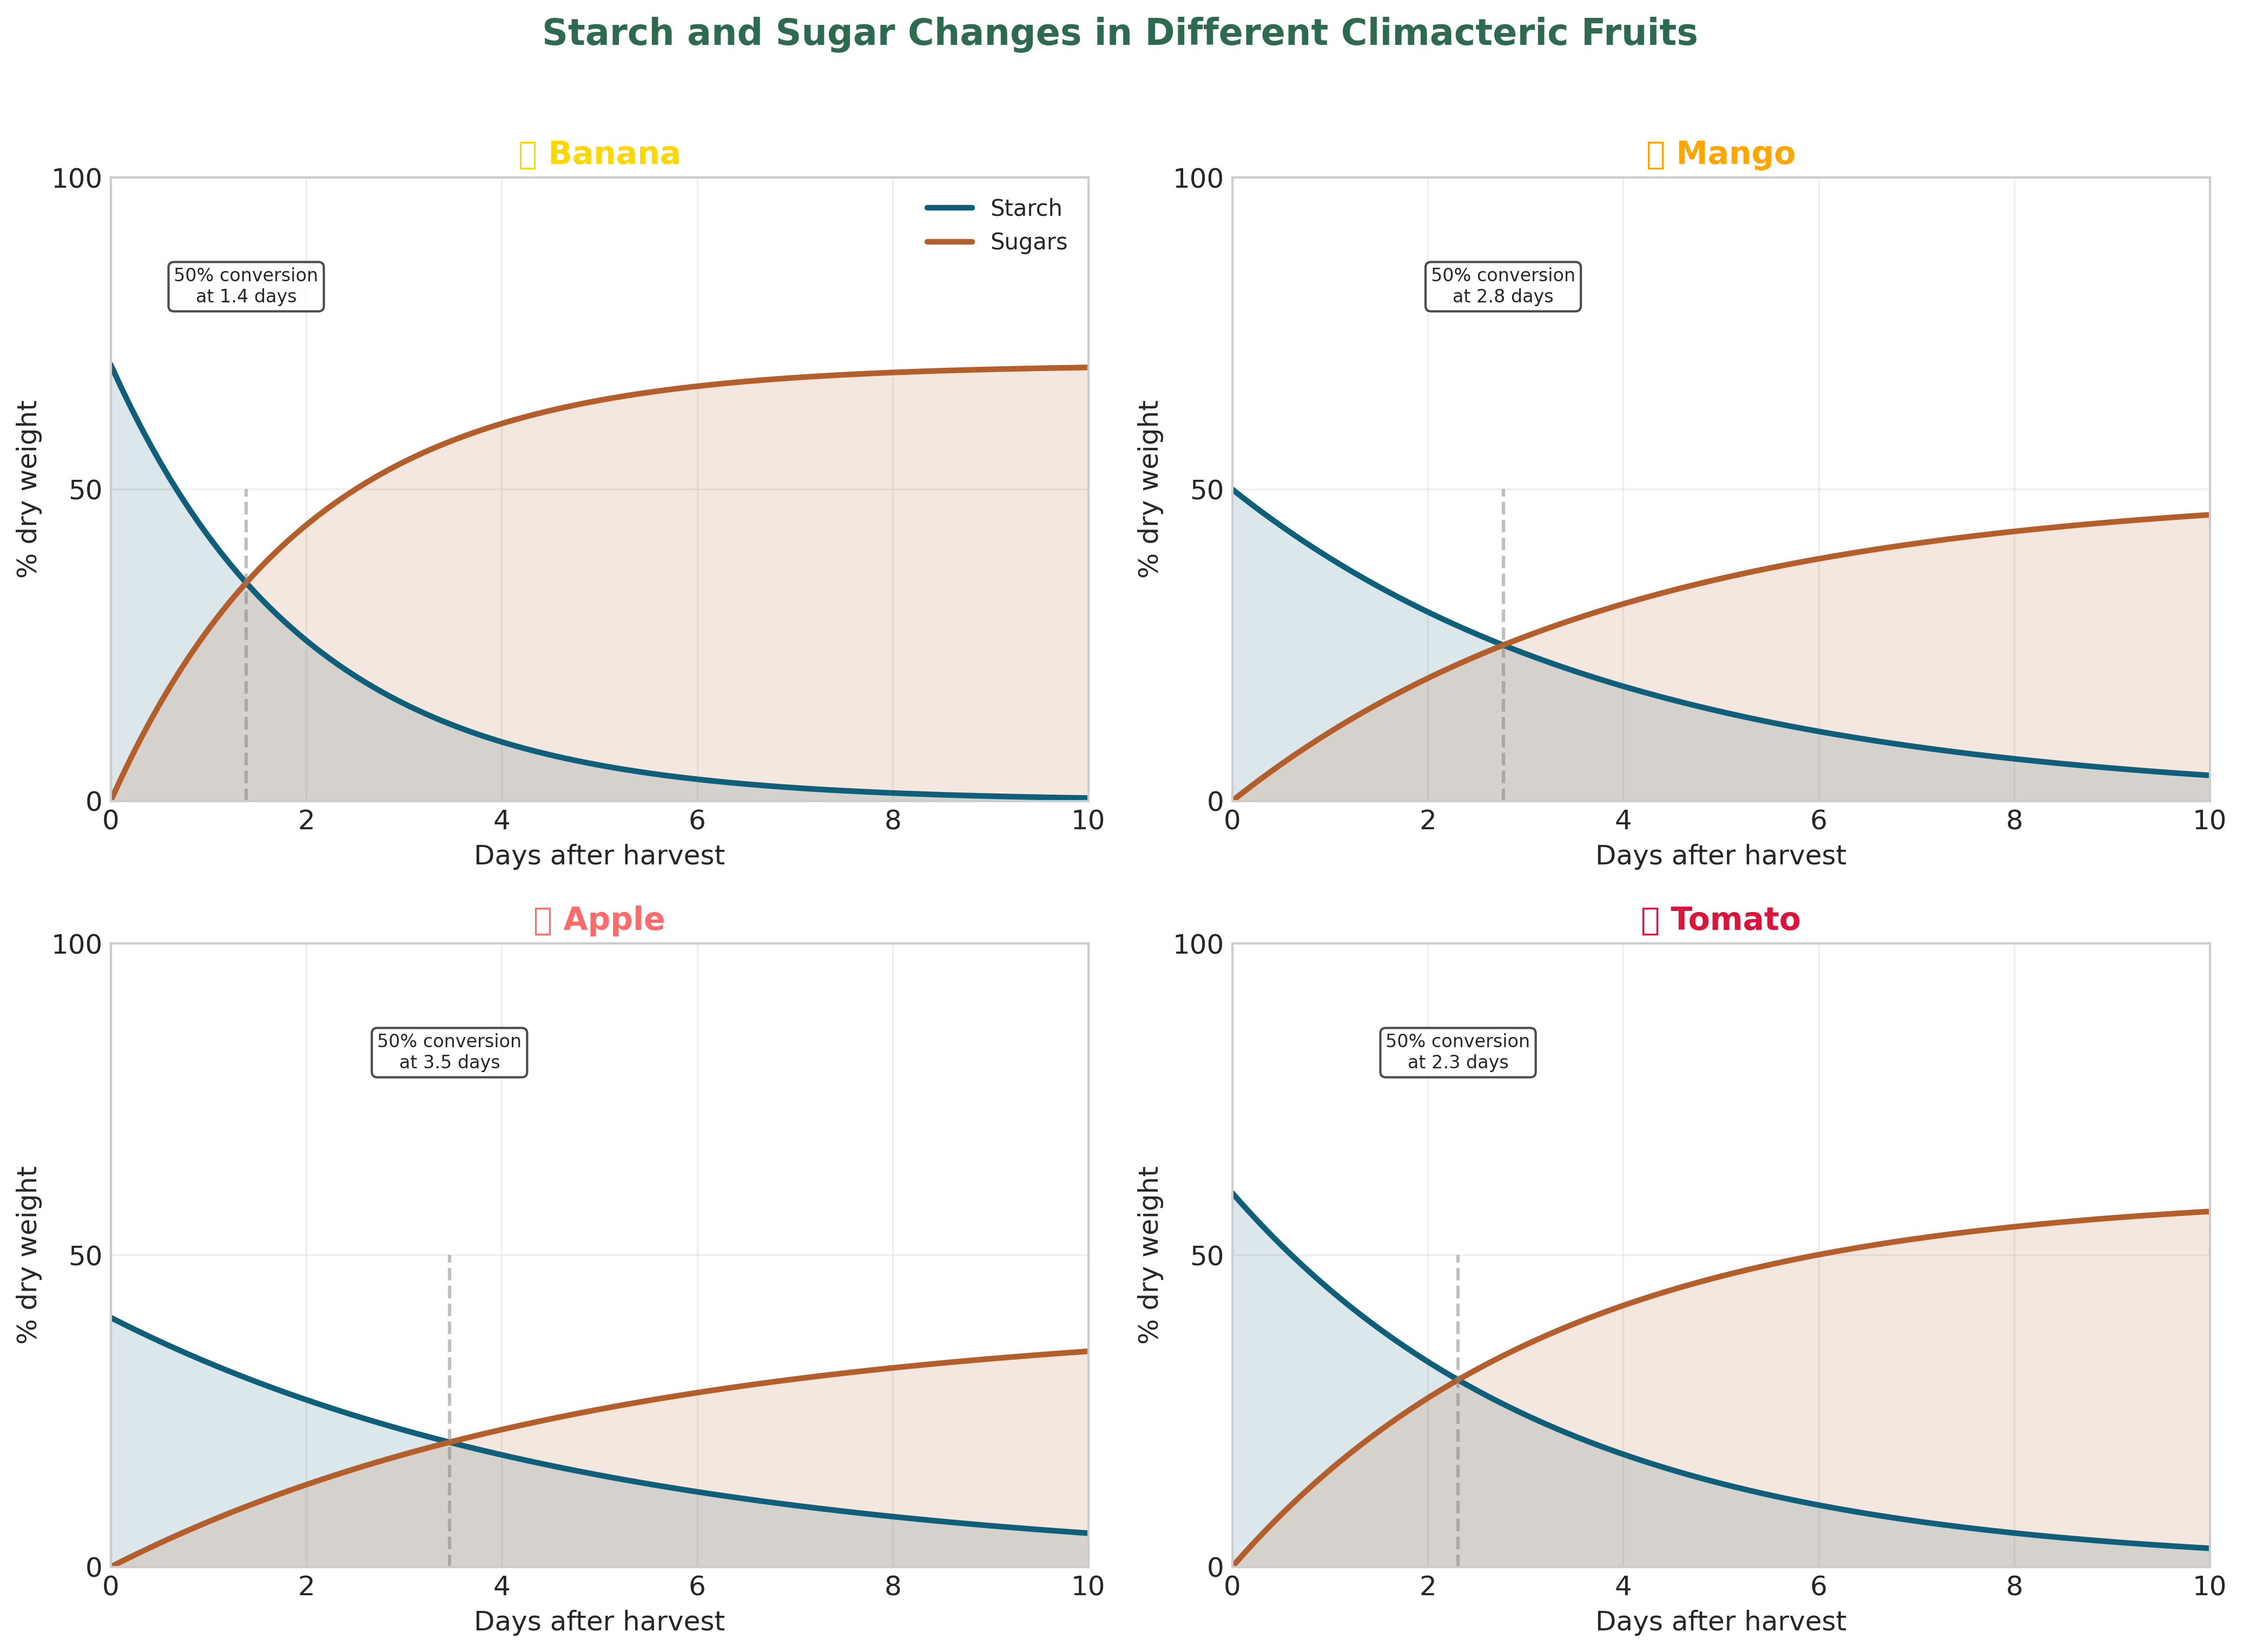
Fruit Ripening Comparison
Different climacteric fruits
images/02_fruit_comparison.png

Enzyme Activities During Ripening
α-amylase, polygalacturonase, ACC synthase
images/03_enzyme_activities.png

Ethylene and Respiration
Climacteric peak
images/04_ethylene_respiration.png
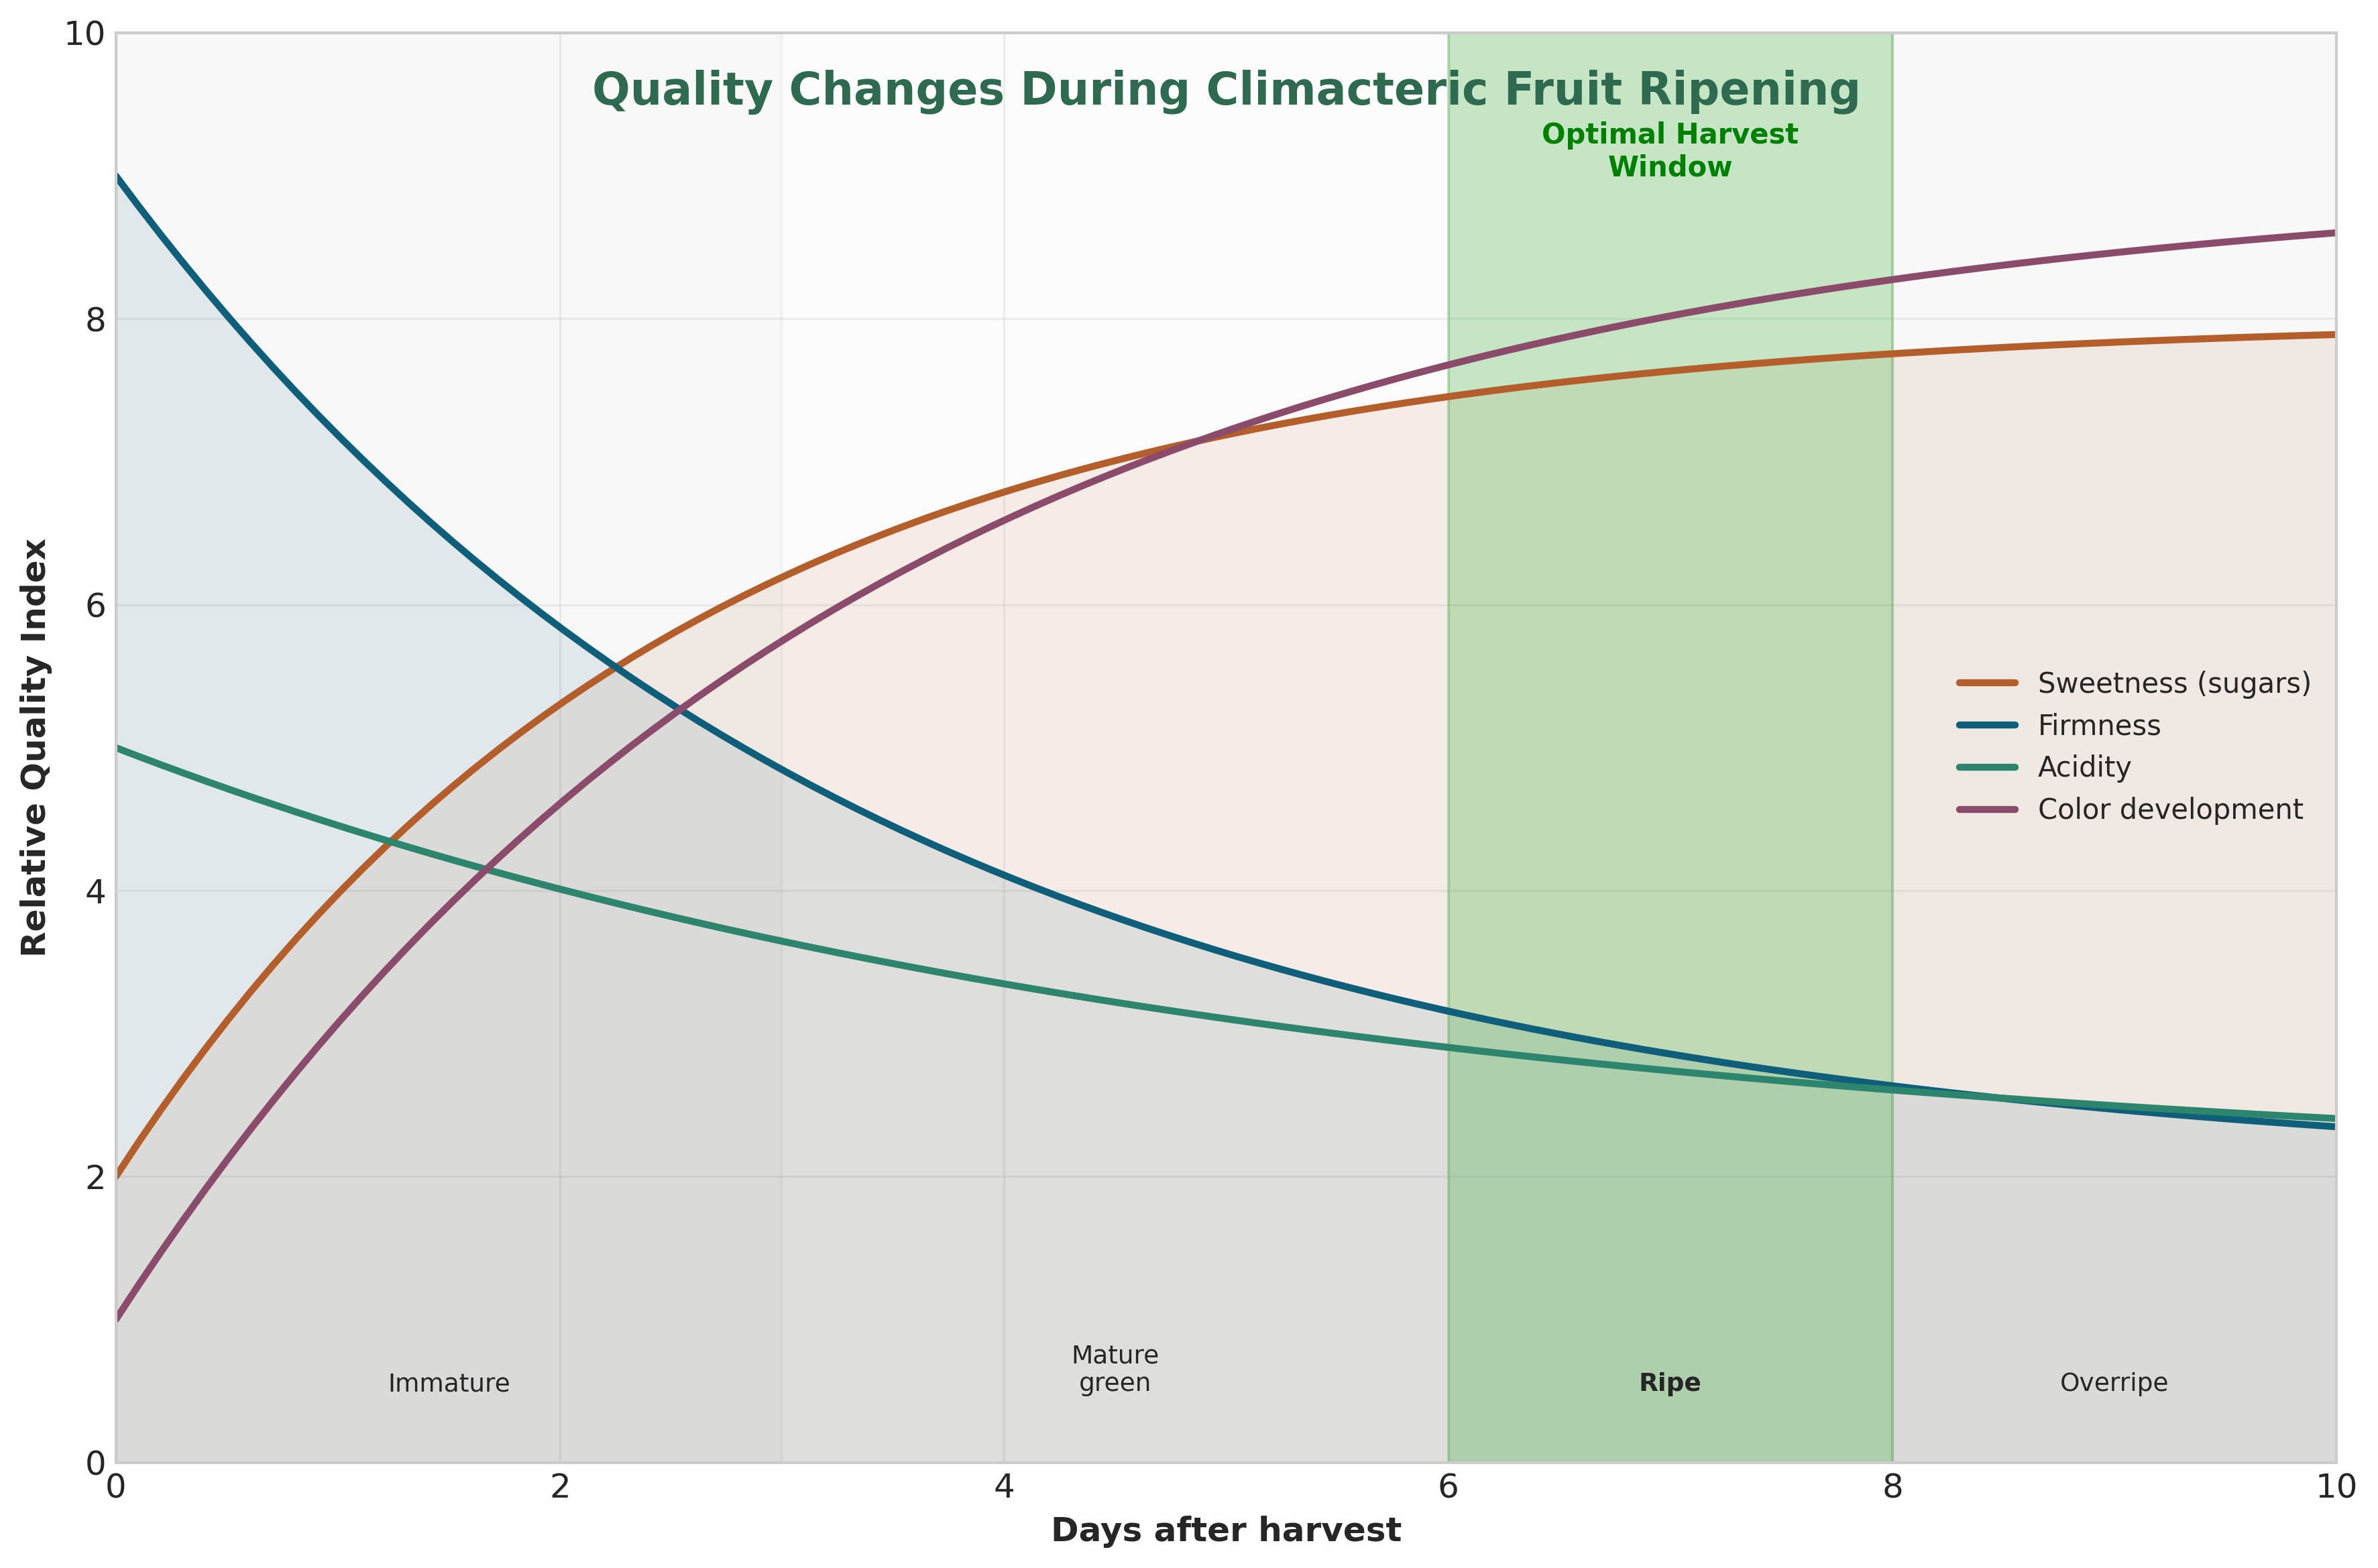
Quality Changes During Ripening
Sweetness, firmness, acidity, color
images/05_quality_changes.png

Climacteric Ripening Summary
Four key processes
images/06_ripening_infographic.png
⚡ Module II · Metabolism & Energy Systems

Chloroplast Structure
Grana, thylakoids, and stroma
images/02_01_chloroplast.png

Light Reactions Overview
PSII, electron transport, PSI, ATP synthesis
images/02_02_light_reactions.png

Z-Scheme (Electron Transport)
Redox potential changes during light reactions
images/02_03_z_scheme.png

Calvin Cycle
Three phases: fixation, reduction, regeneration
images/02_04_calvin_cycle.png

C3 vs C4 vs CAM
Photosynthetic adaptations and examples
images/02_05_c3_c4_cam.png

Glycolysis Overview
Energy investment and payoff phases
images/02_06_glycolysis.png

Krebs Cycle
Key intermediates and energy carriers
images/02_07_krebs_cycle.png

Electron Transport Chain
Complexes I-IV, proton pumping, ATP synthase
images/02_08_electron_transport_chain.png

ATP Synthase Mechanism
Rotor-stator, proton flow drives ATP synthesis
images/02_09_atp_synthase.png
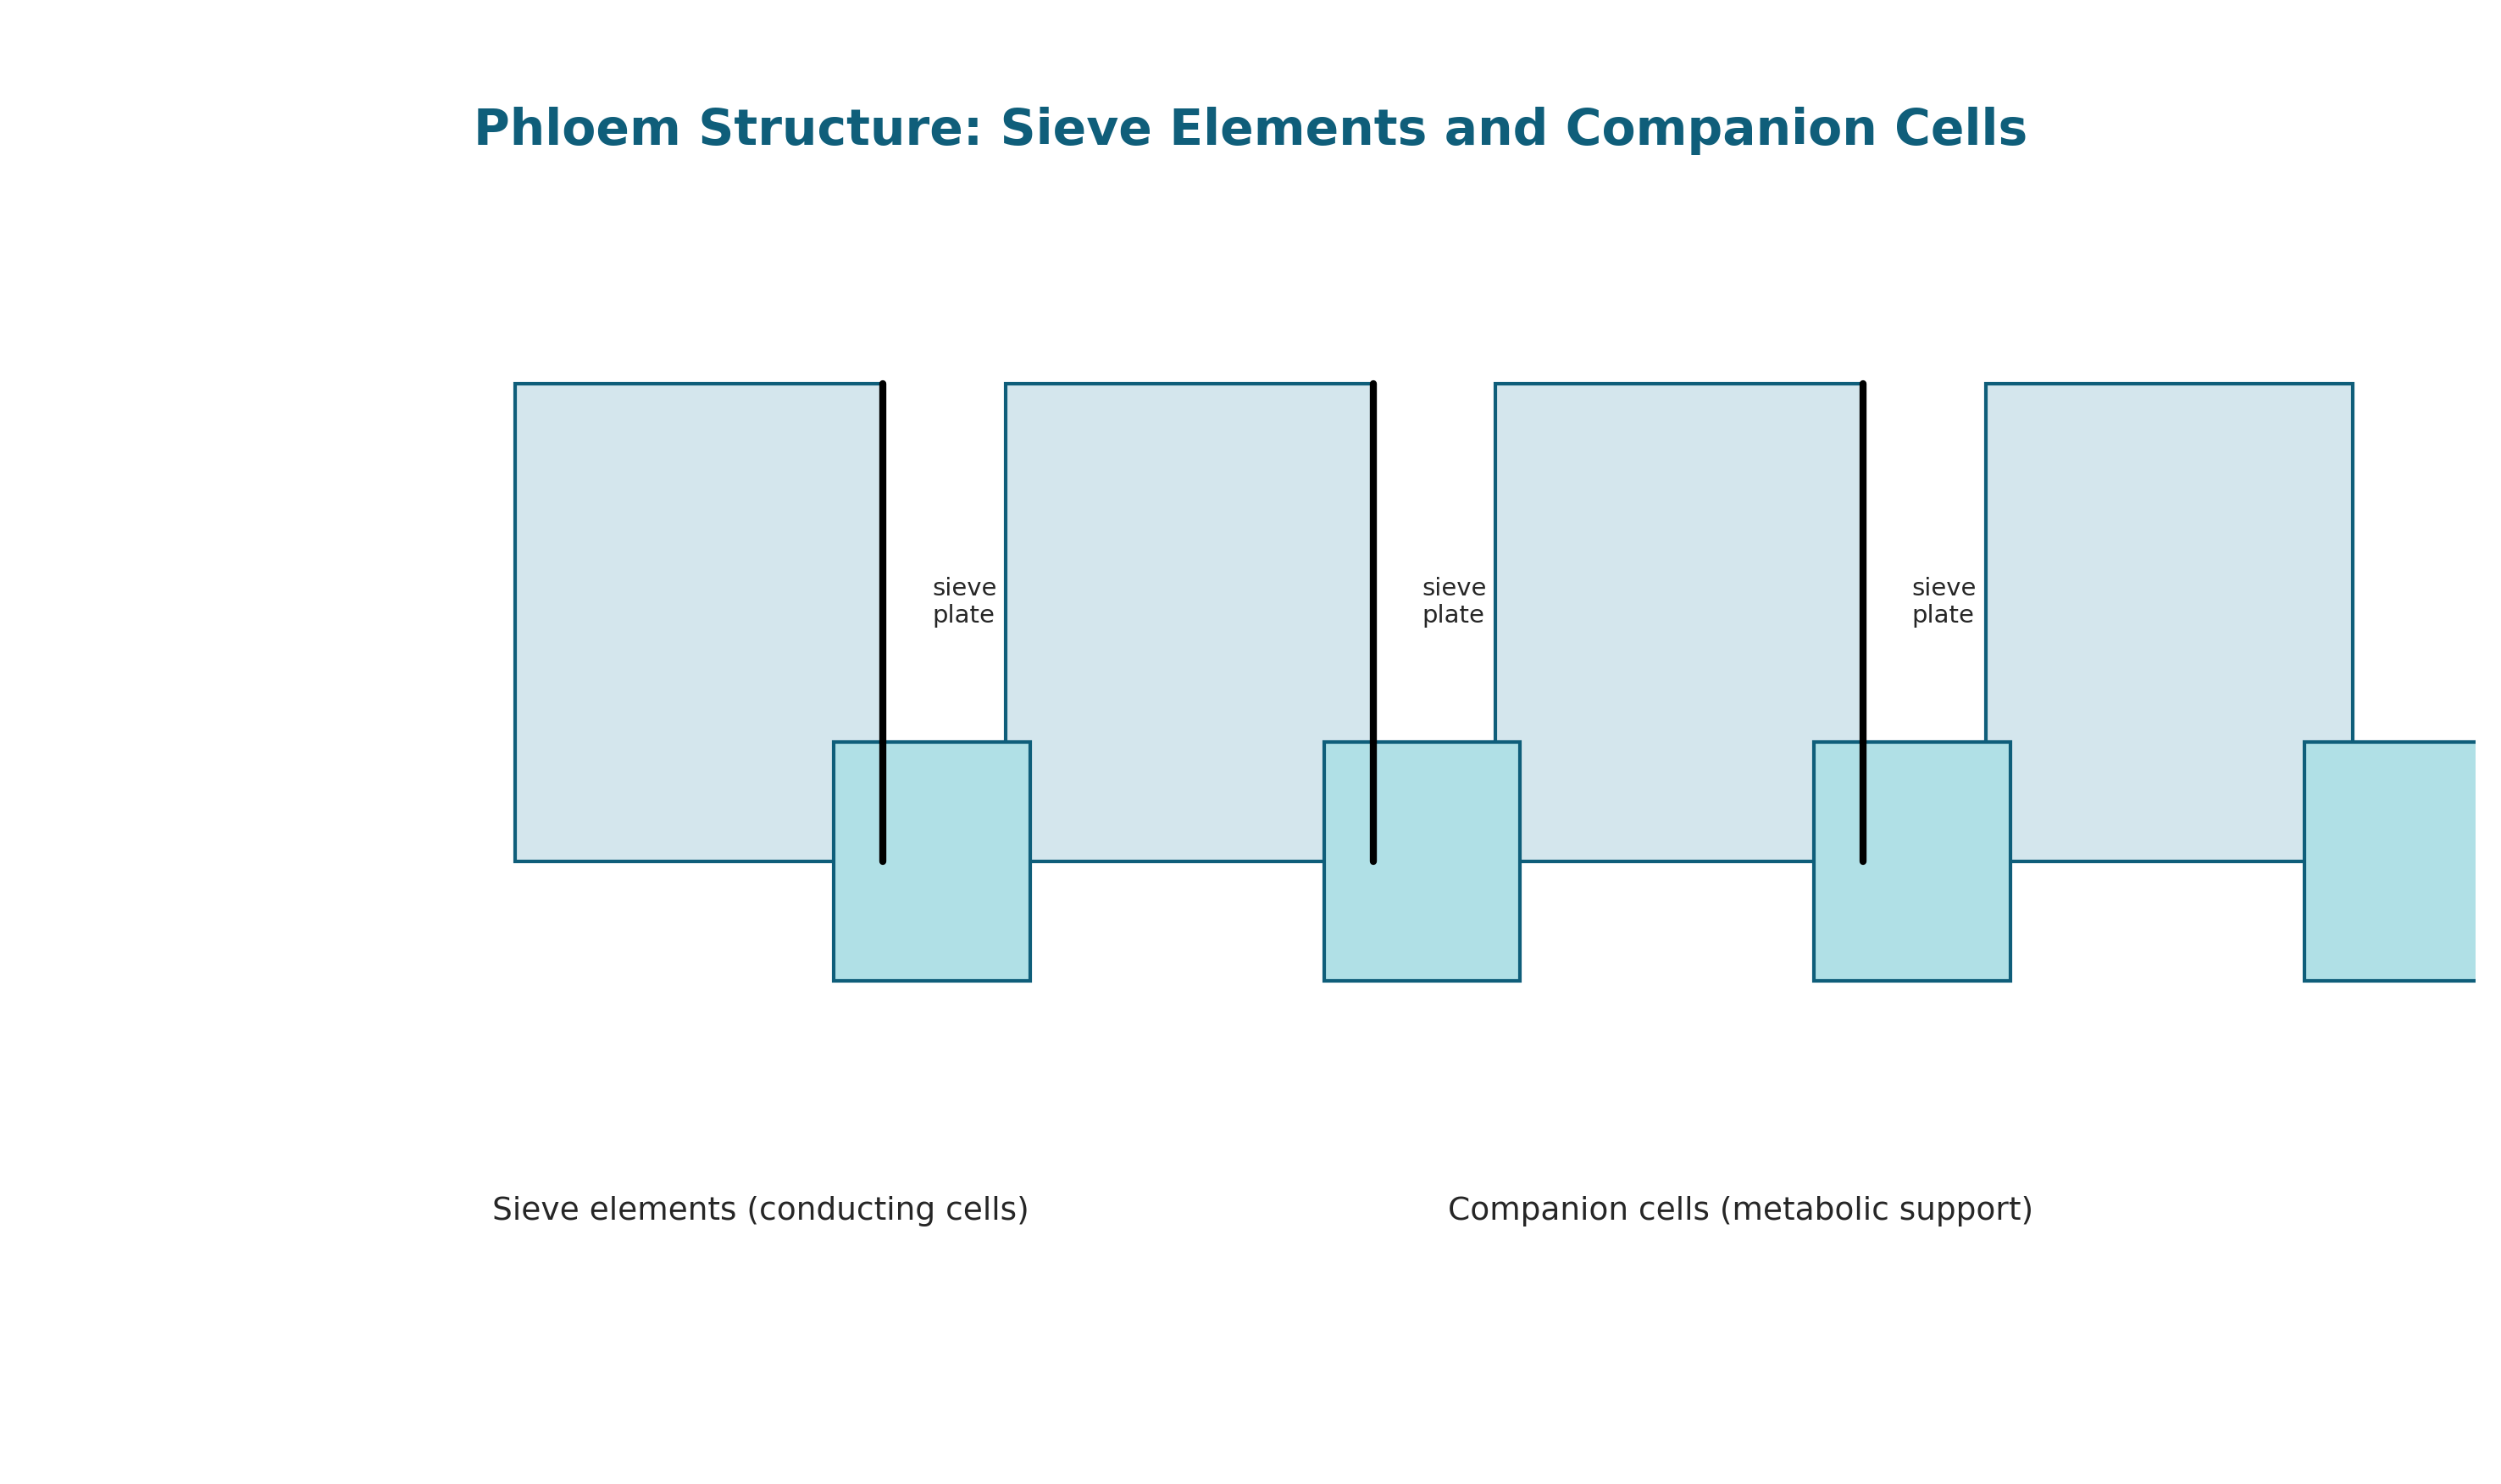
Phloem Structure
Sieve elements and companion cells
images/02_10_phloem_structure.png
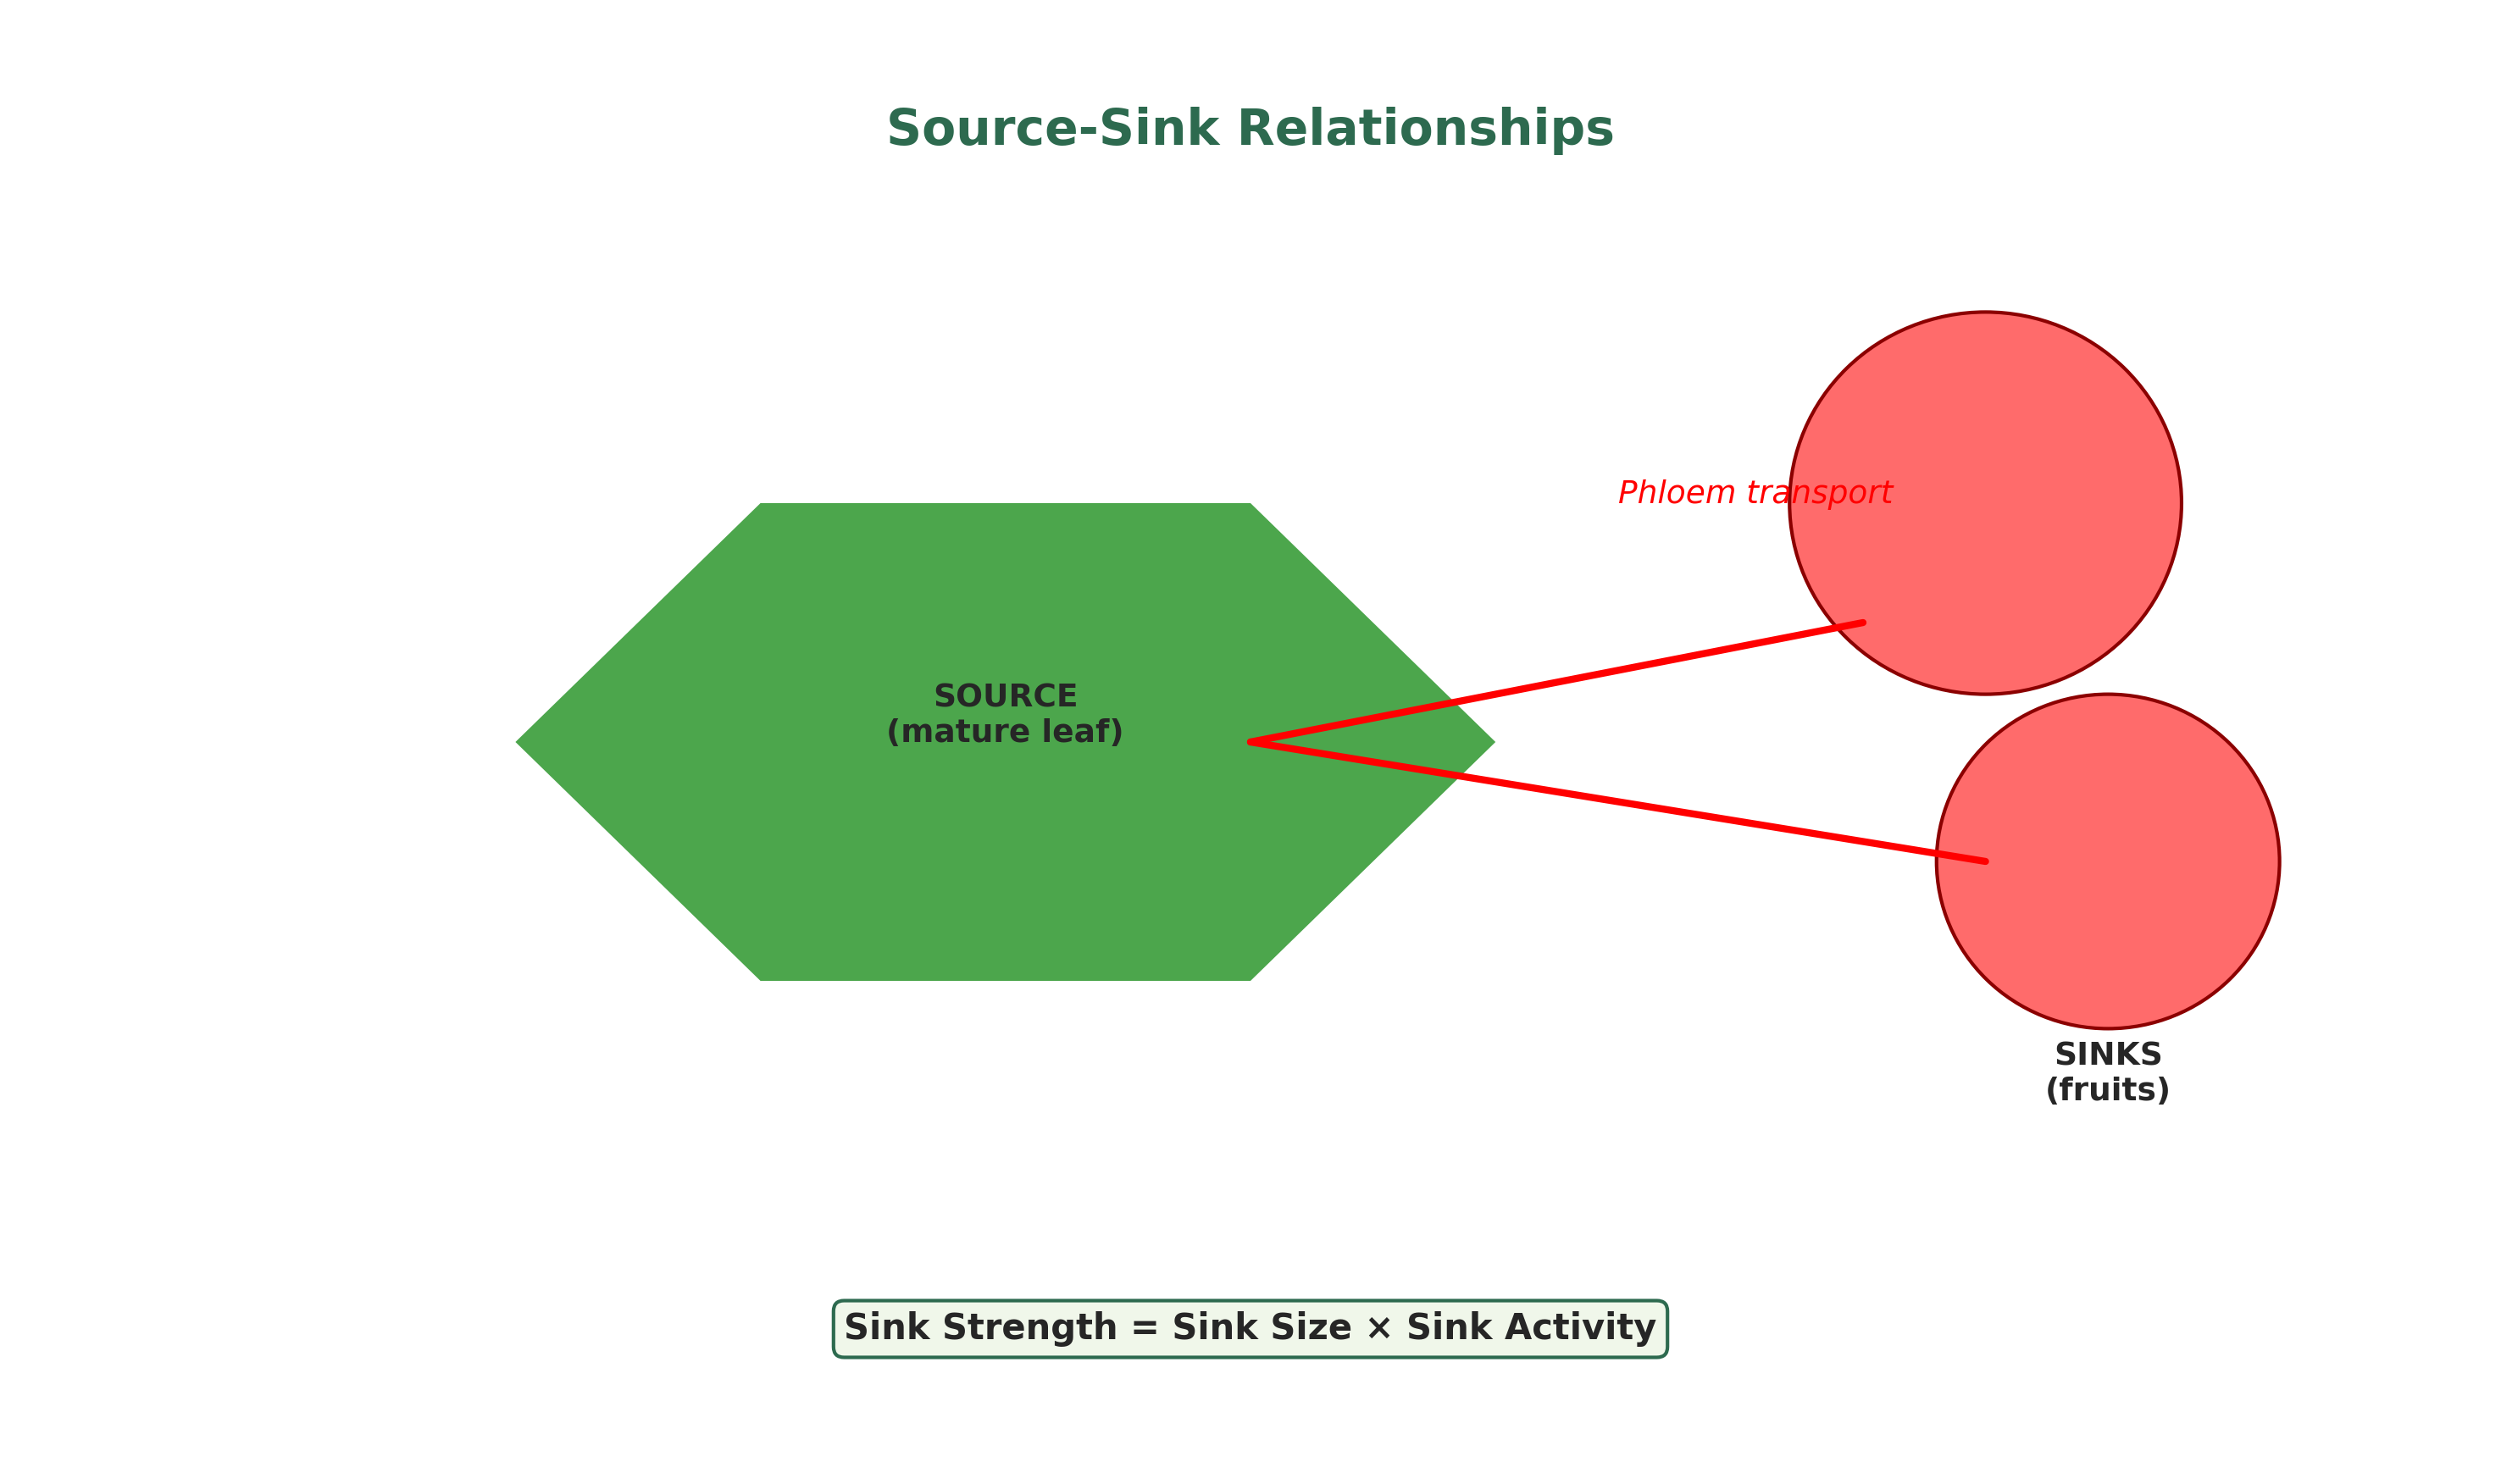
Source-Sink Relationships
Sugar transport from leaves to fruits
images/02_11_source_sink.png

GS-GOGAT Pathway
Nitrogen assimilation into amino acids
images/02_12_gs_gogat.png

Biological Nitrogen Fixation
Legume-rhizobia symbiosis, nodules
images/02_13_nitrogen_fixation.png

Fatty Acid Synthesis
ACCase, FAS complex, chain elongation
images/02_14_fatty_acid_synthesis.png

Kennedy Pathway
Triglyceride assembly (GPAT, LPAAT, DGAT)
images/02_15_kennedy_pathway.png

Energy Accounting Summary
ATP yield from glucose (36-38 ATP)
images/02_16_energy_summary.png
📈 Module III · Productivity & Quality

Harvest Index Concept
Traditional vs modern varieties showing HI increase from 0.3 to 0.5
images/03_01_harvest_index_concept.png

Harvest Index by Crop Type
Typical HI values: cereals 0.5, root crops 0.7, leafy veg 0.85
images/03_02_hi_values.png

Green Revolution Impact
Historical increase in harvest index for wheat and rice (1960-2010)
images/03_03_green_revolution.png

Sugar Sweetness Comparison
Relative sweetness of sugars (sucrose = 1.0): fructose (1.7), glucose (0.7)
images/03_04_sugar_sweetness.png
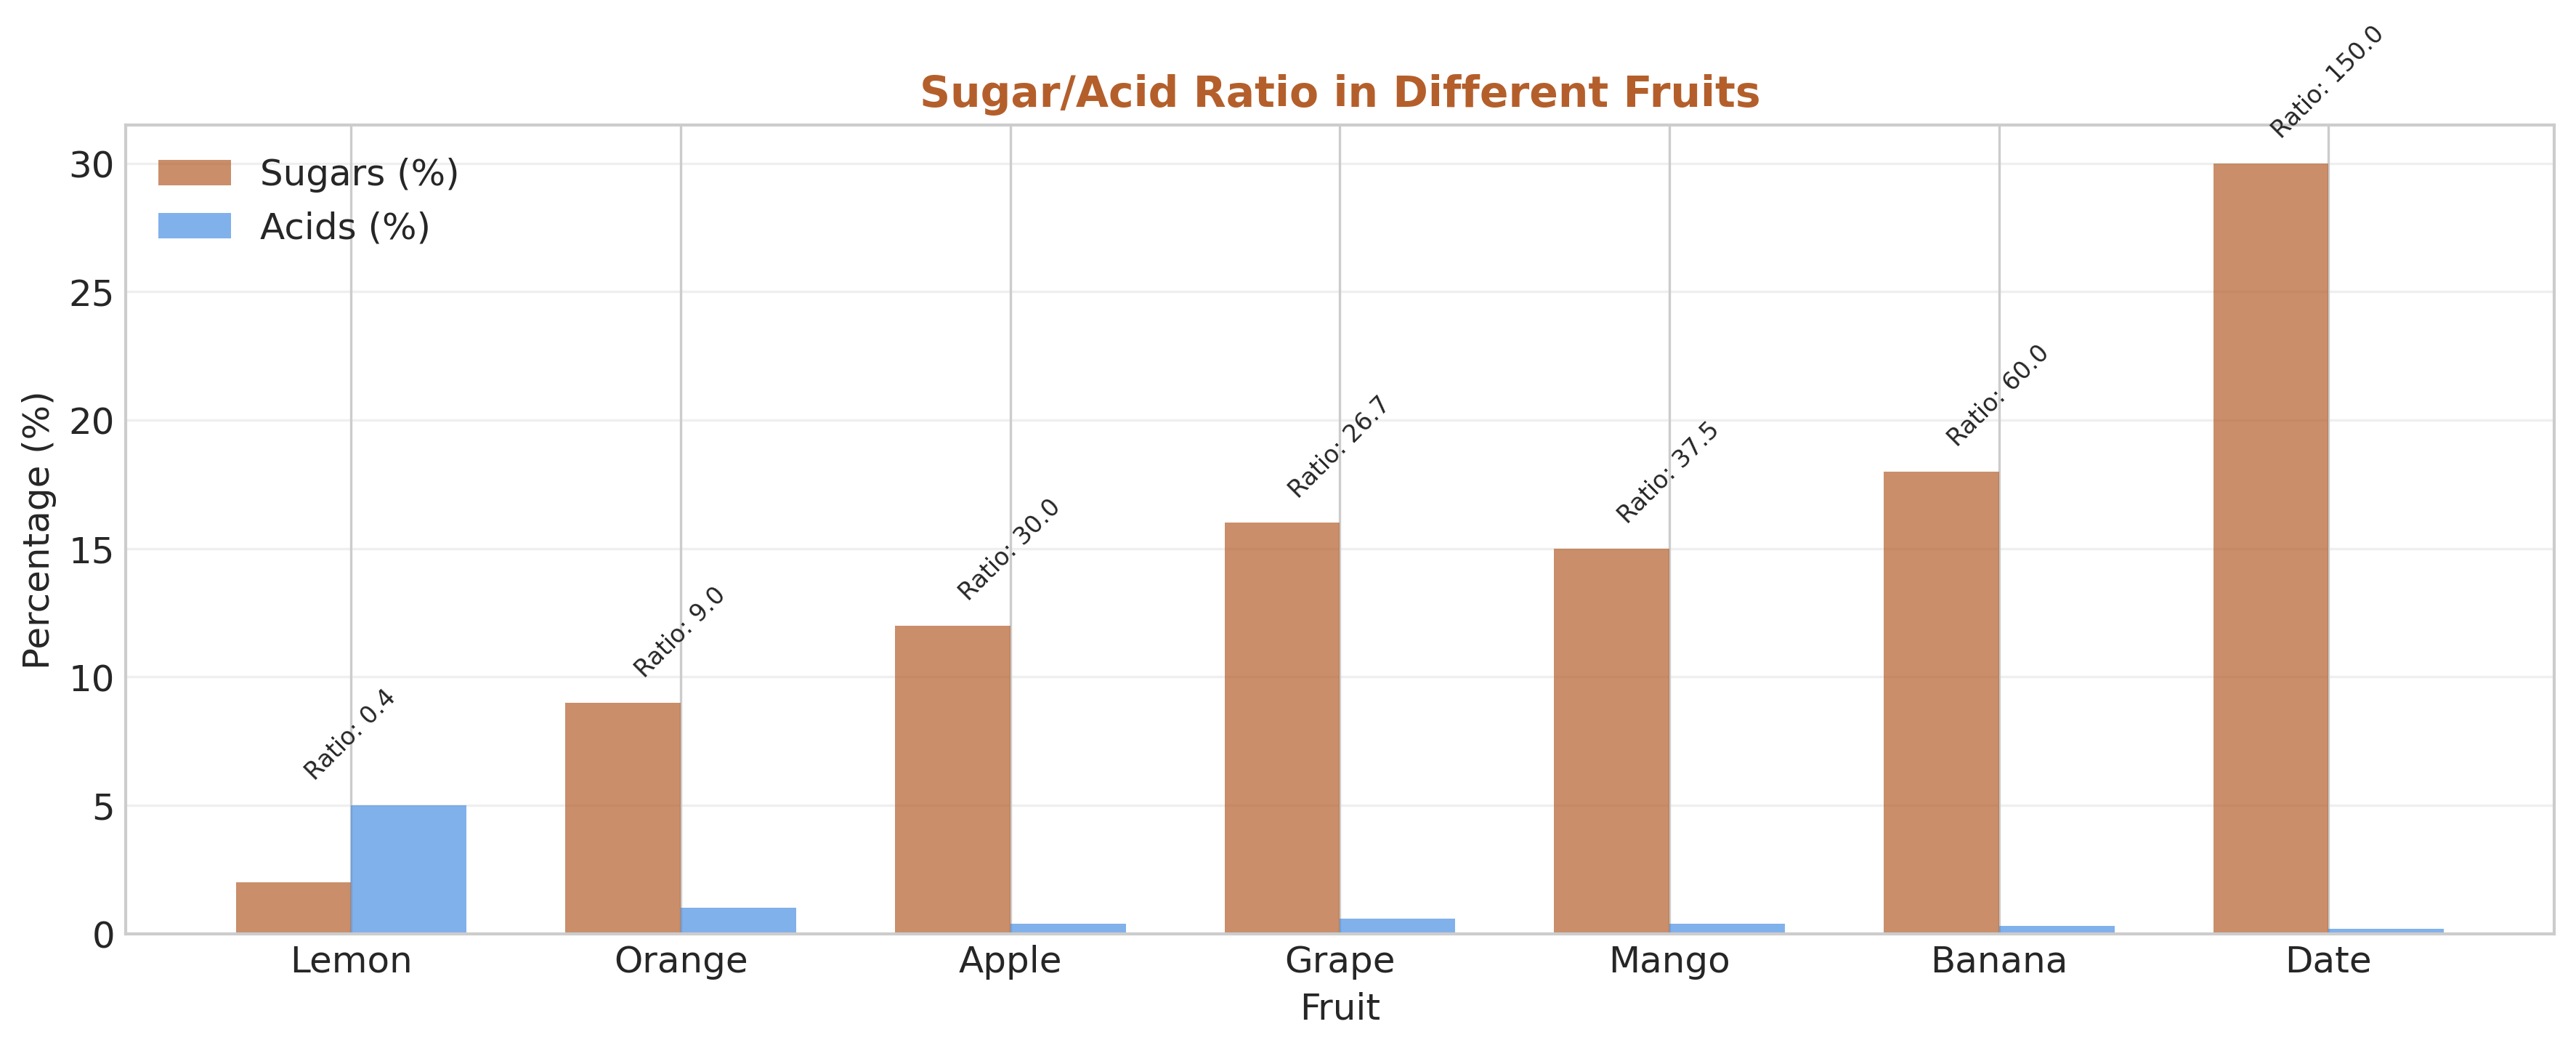
Sugar/Acid Ratio in Fruits
Balance between sugars and acids determines fruit flavor quality
images/03_05_sugar_acid_ratio.png
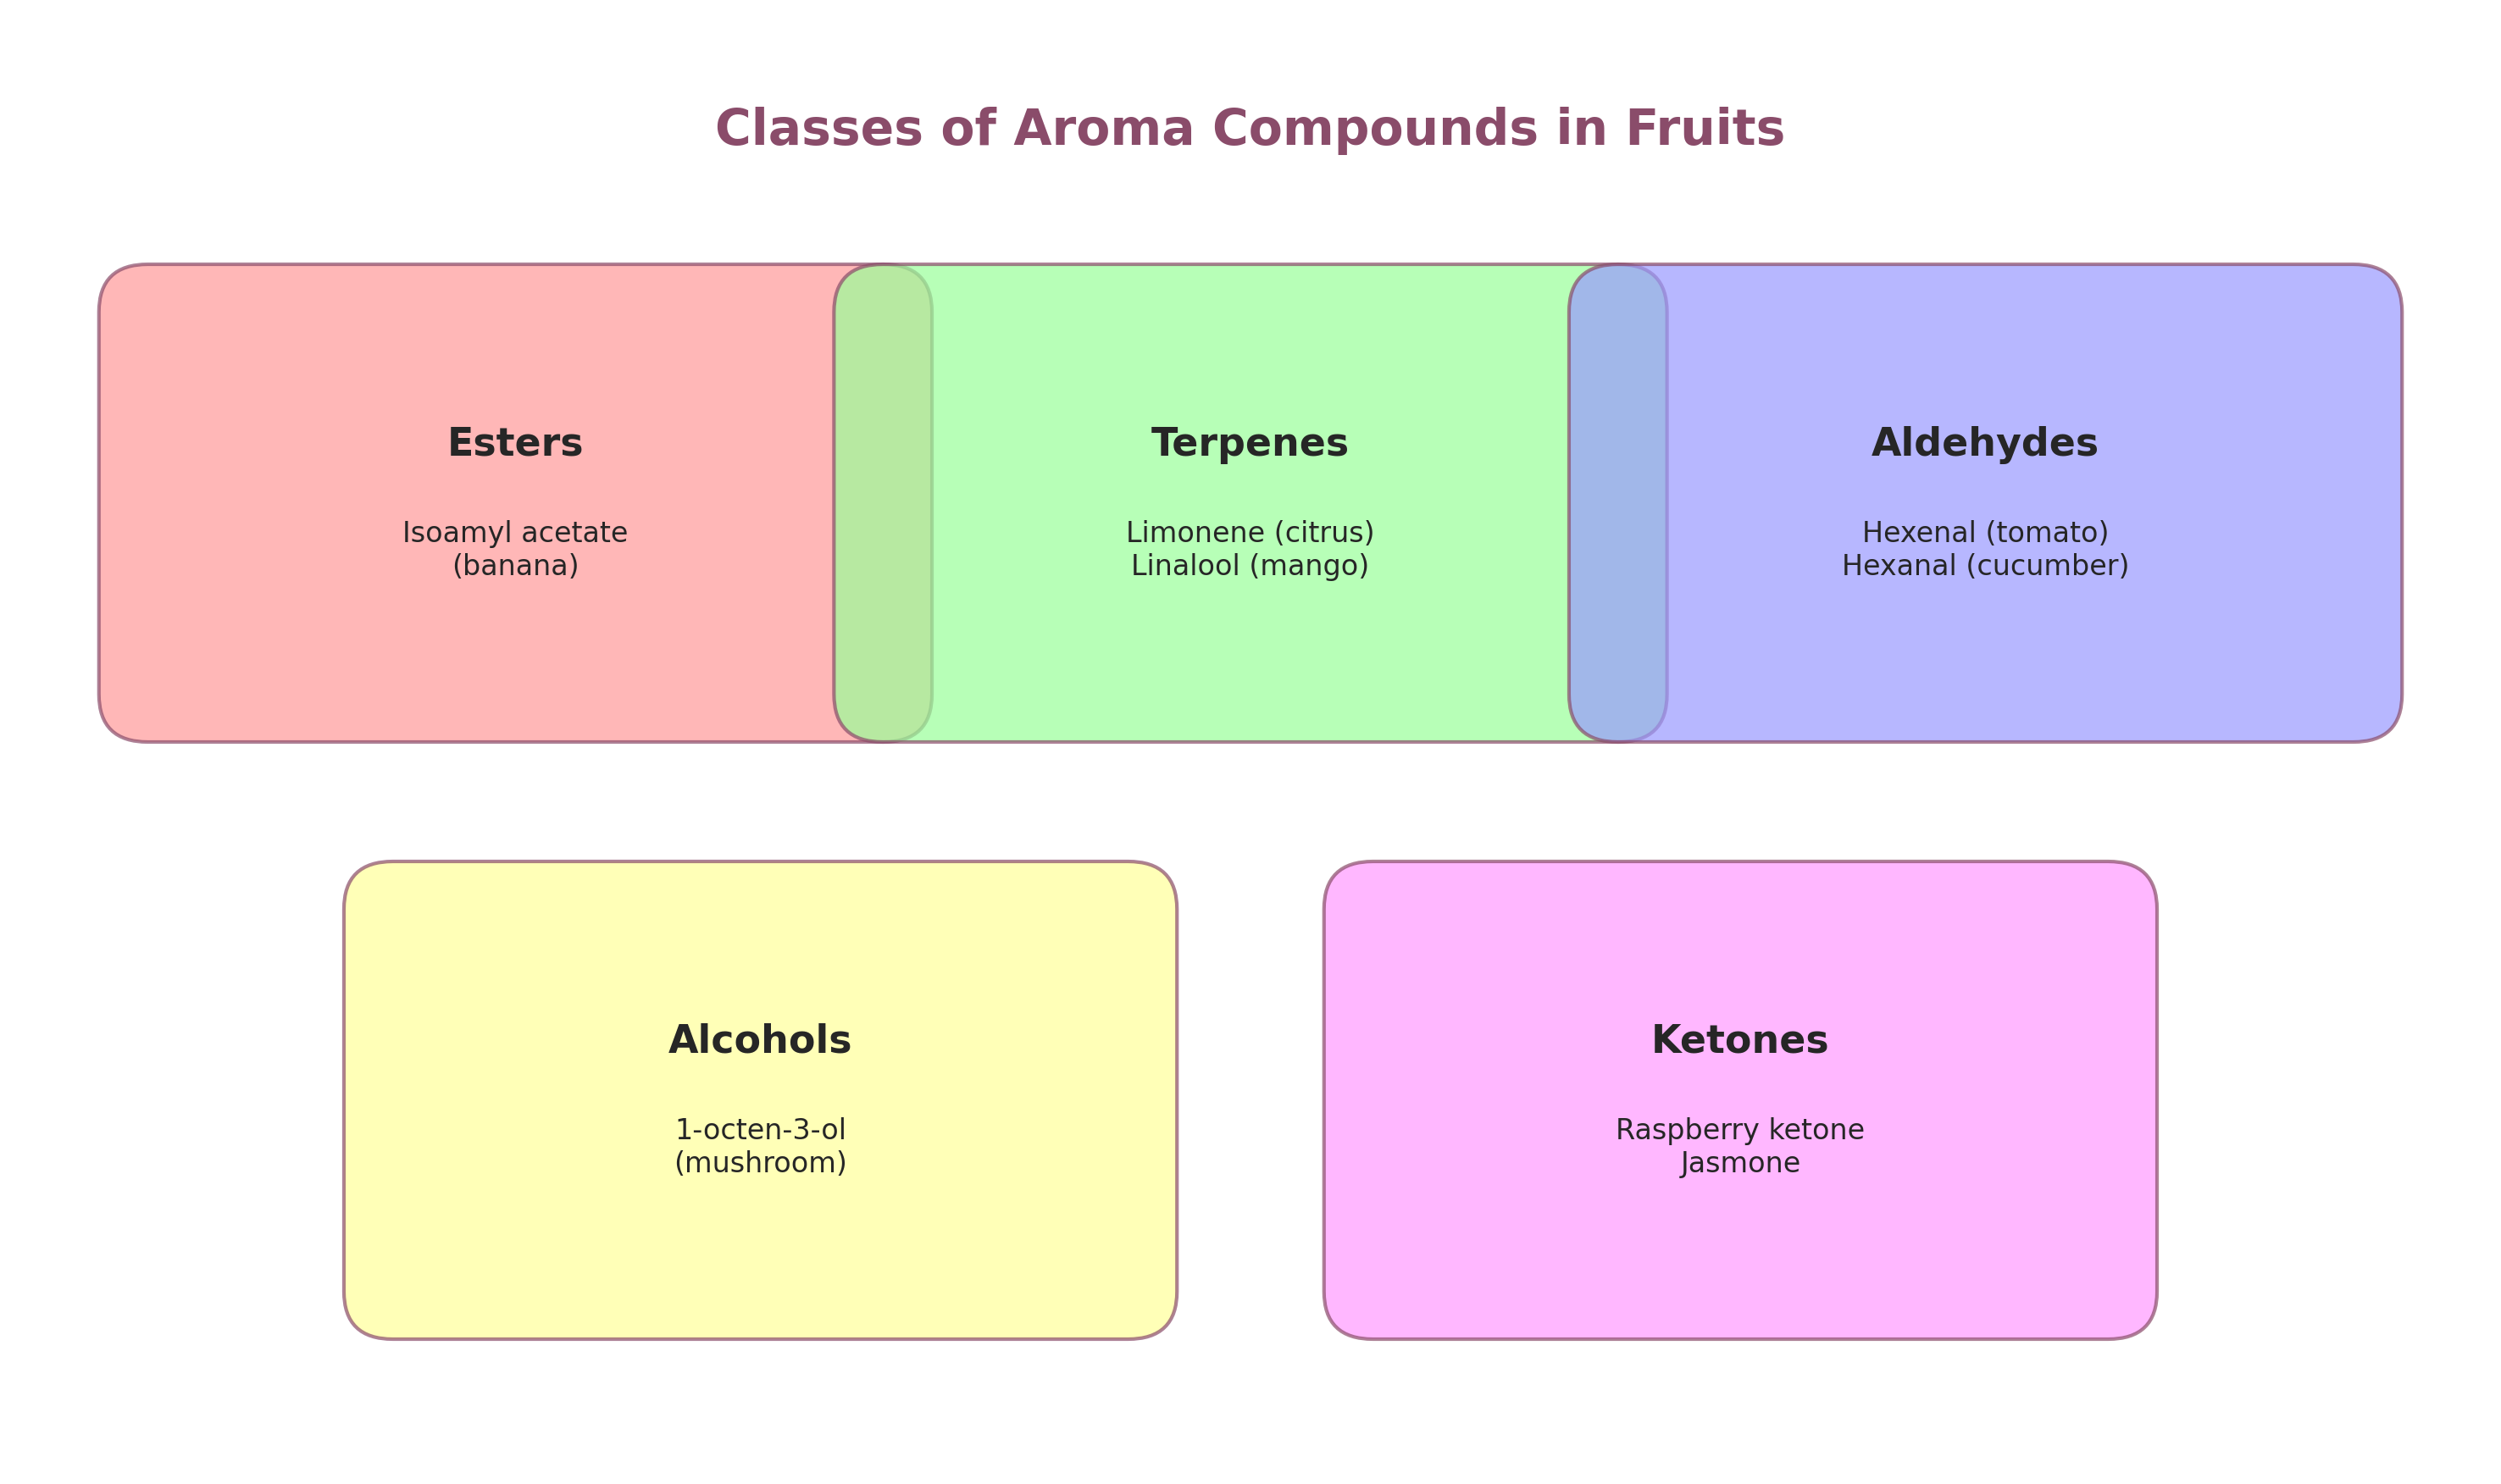
Aroma Compound Classes
Esters (banana), terpenes (citrus), aldehydes (tomato), and more
images/03_06_aroma_classes.png

Vitamin Content in Fruits
Vitamin C and vitamin A levels in common fruits
images/03_07_vitamin_content.png

Antioxidant Capacity (ORAC)
ORAC values: wild blueberries (9600), pomegranate (4500), blackberries (4000)
images/03_08_orac_values.png

Plant Pigment Classes
Chlorophylls (green), carotenoids (yellow/orange), anthocyanins (red/purple), betalains (red/yellow)
images/03_09_pigment_classes.png

Ripening Color Changes
Pigment changes during fruit ripening: tomato (lycopene), banana (carotenoids), strawberry (pelargonidin)
images/03_10_ripening_colors.png

Respiration Rate vs Storage Life
Inverse relationship: high respiration (asparagus) = short life, low respiration (onion) = long life
images/03_11_respiration_storage.png

Q₁₀ Temperature Effect
Respiration rate doubles/triples for every 10°C increase (Q₁₀ = 2-3)
images/03_12_q10_effect.png

Ethylene in Climacteric Ripening
Ethylene burst triggers respiration peak and ripening processes
images/03_13_ethylene_ripening.png

1-MCP (SmartFresh™) Mechanism
1-MCP blocks ethylene receptors, preventing ripening and senescence
images/03_14_1mcp_mechanism.png
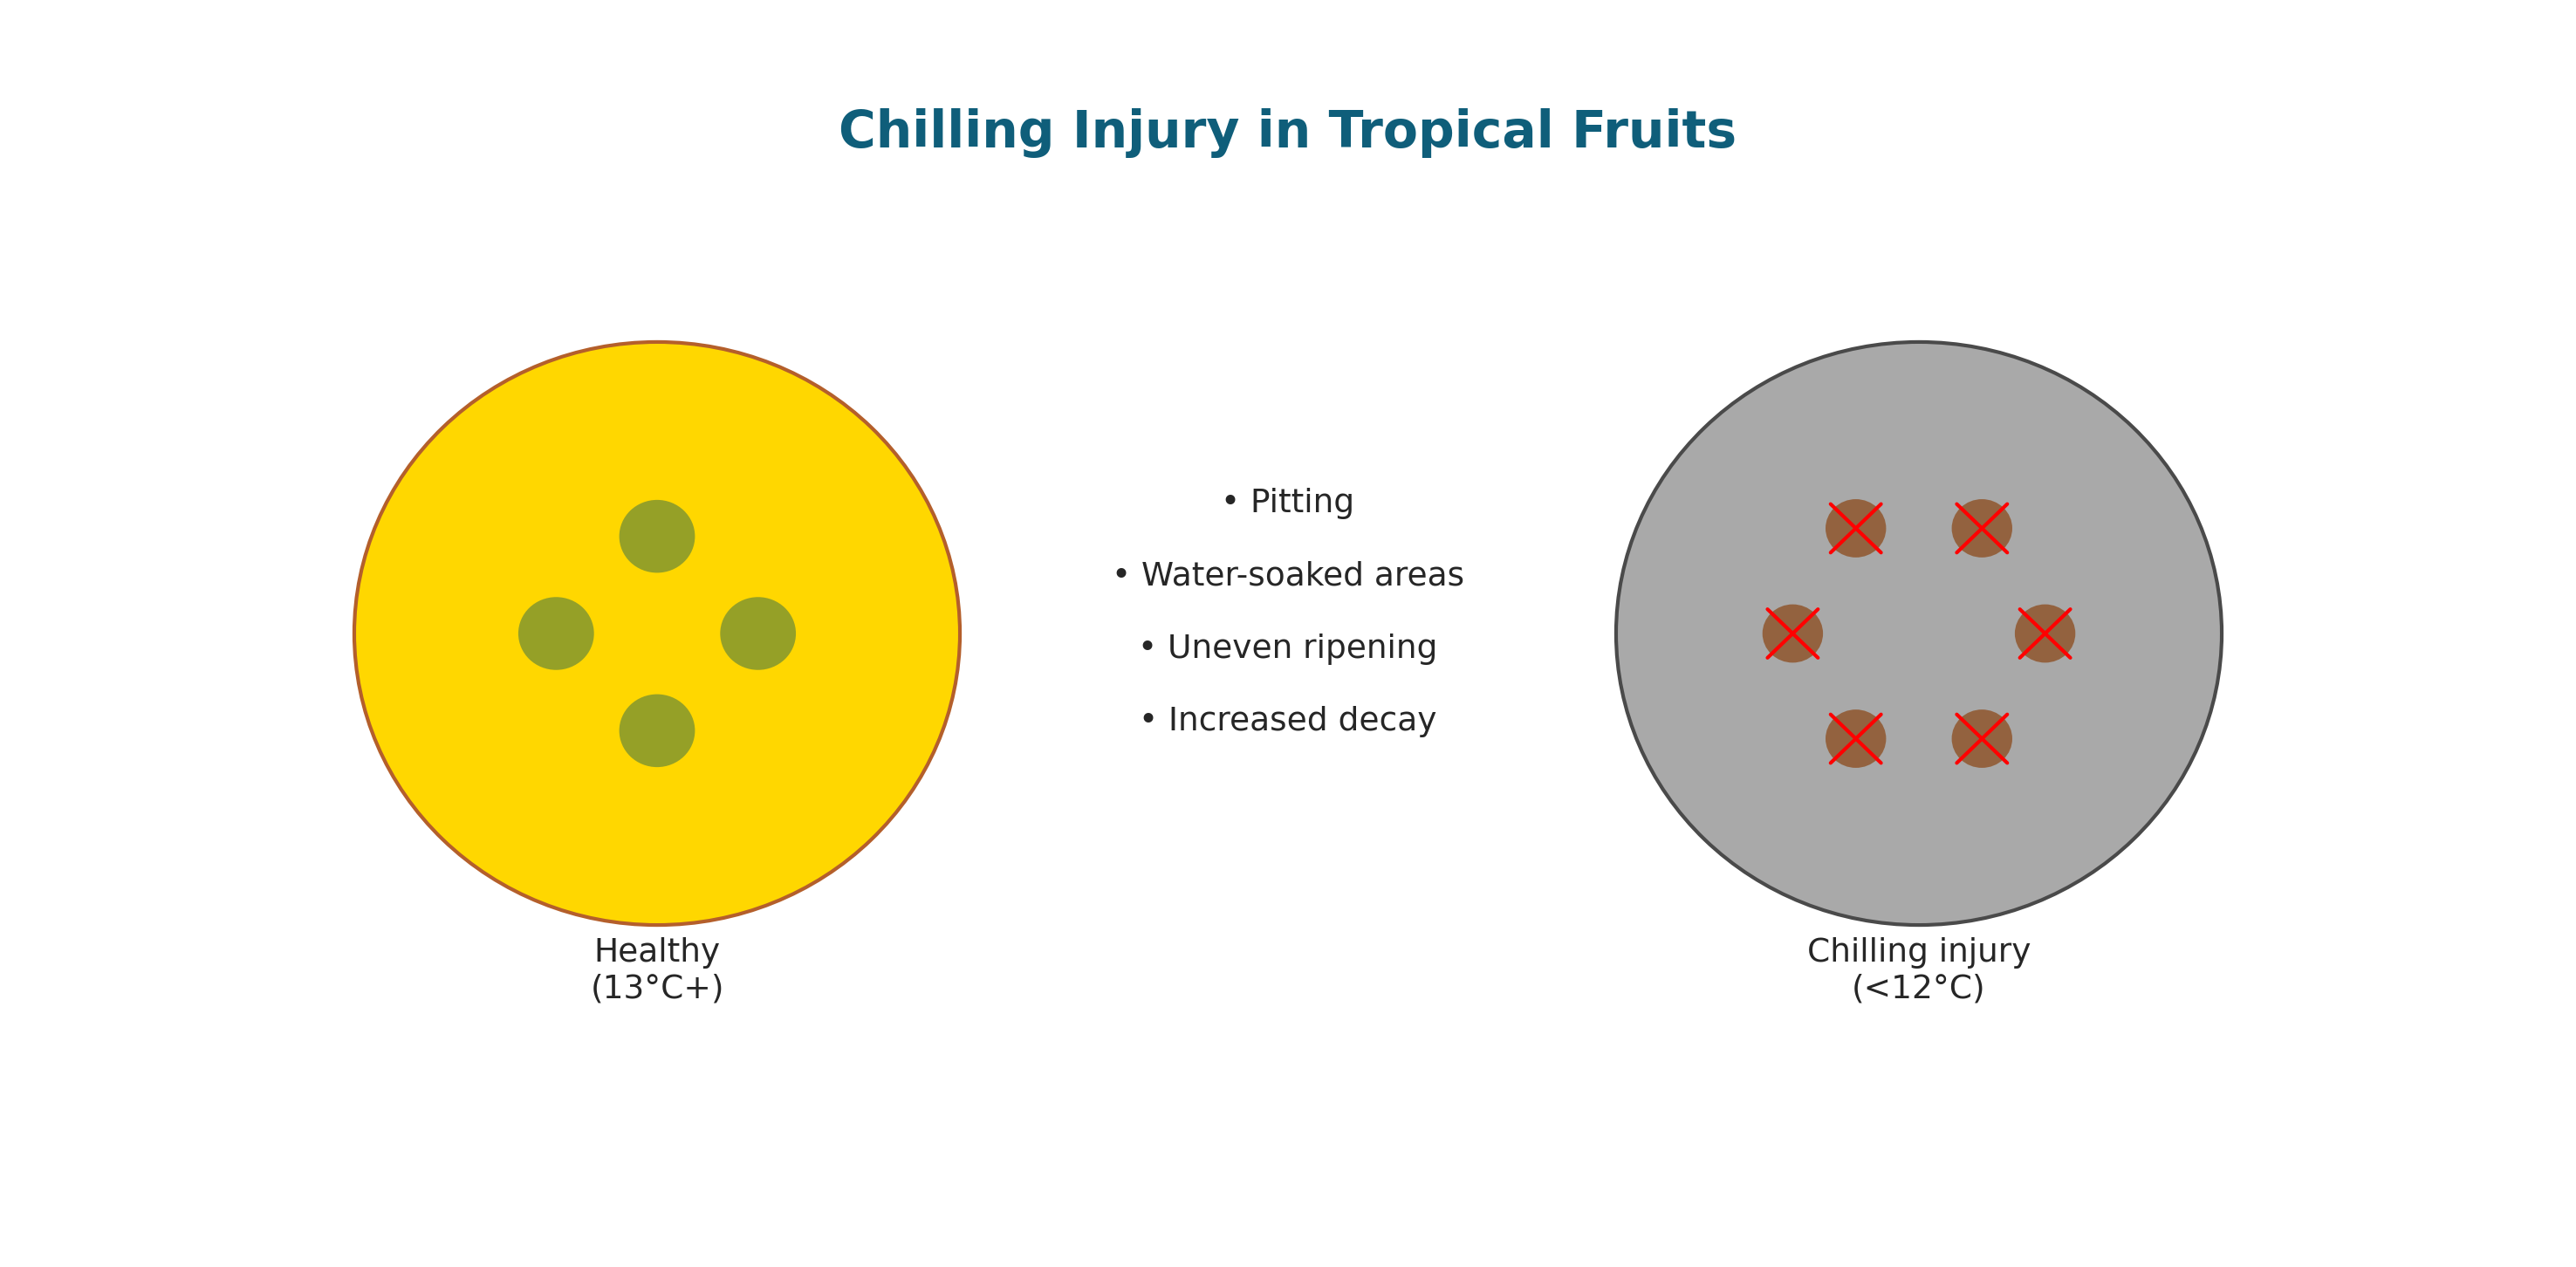
Chilling Injury in Tropical Fruits
Symptoms: pitting, water-soaked areas, uneven ripening at temperatures below 12°C
images/03_15_chilling_injury.png

Quality Parameters Summary
Comprehensive table of quality metrics: harvest index, flavor, nutrition, pigments, post-harvest
images/03_16_quality_summary.png
🌵 Module IV · Stress & Environmental Biochemistry

Abiotic Stress Types
Drought, salinity, temperature extremes, and flooding
images/04_01_abiotic_stress_types.png

Drought Stress Mechanisms
ABA signaling, osmotic adjustment, antioxidant defense, LEA proteins
images/04_02_drought_stress.png

SOS Pathway: Salt Tolerance
SOS3 senses Ca²⁺, activates SOS2 kinase, which phosphorylates SOS1 Na⁺/H⁺ antiporter
images/04_03_sos_pathway.png

Compatible Solutes (Osmoprotectants)
Proline, glycine betaine, trehalose, sugars maintain turgor and protect proteins
images/04_04_compatible_solutes.png

Temperature Stress Responses
Heat stress (HSPs, protein denaturation) and cold stress (CBF pathway, membrane unsaturation)
images/04_05_temperature_stress.png

Secondary Metabolites Classes
Terpenes, phenolics, alkaloids: their precursors and functions
images/04_06_secondary_metabolites.png

Phenylpropanoid Pathway
From phenylalanine to flavonoids, lignin, and tannins via PAL, C4H, and other enzymes
images/04_07_phenylpropanoid.png
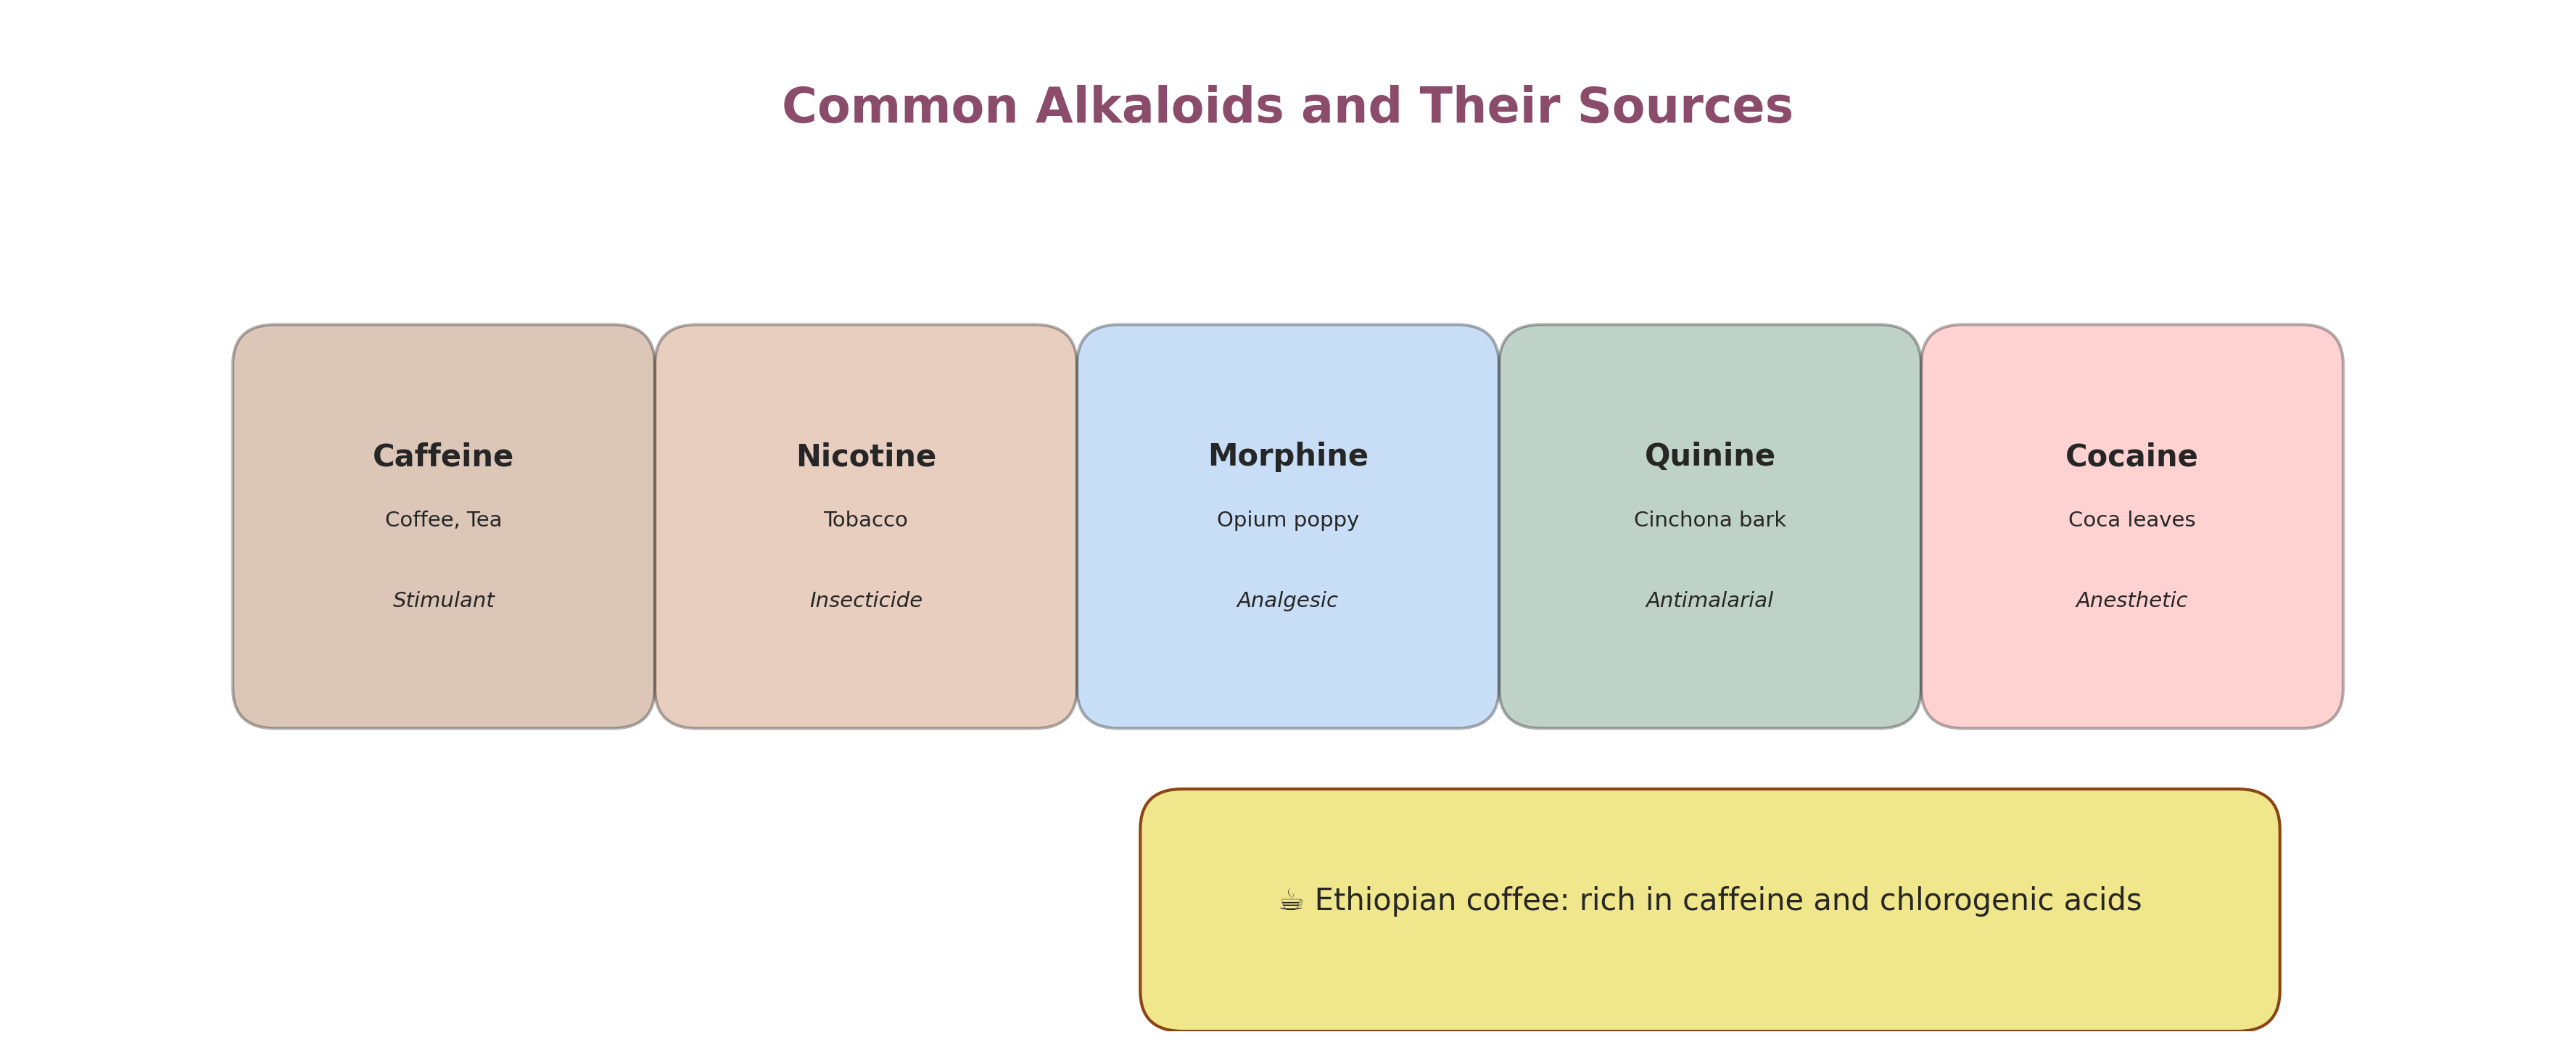
Common Alkaloids and Sources
Caffeine (coffee), nicotine (tobacco), morphine (opium poppy), quinine (cinchona)
images/04_08_alkaloids.png
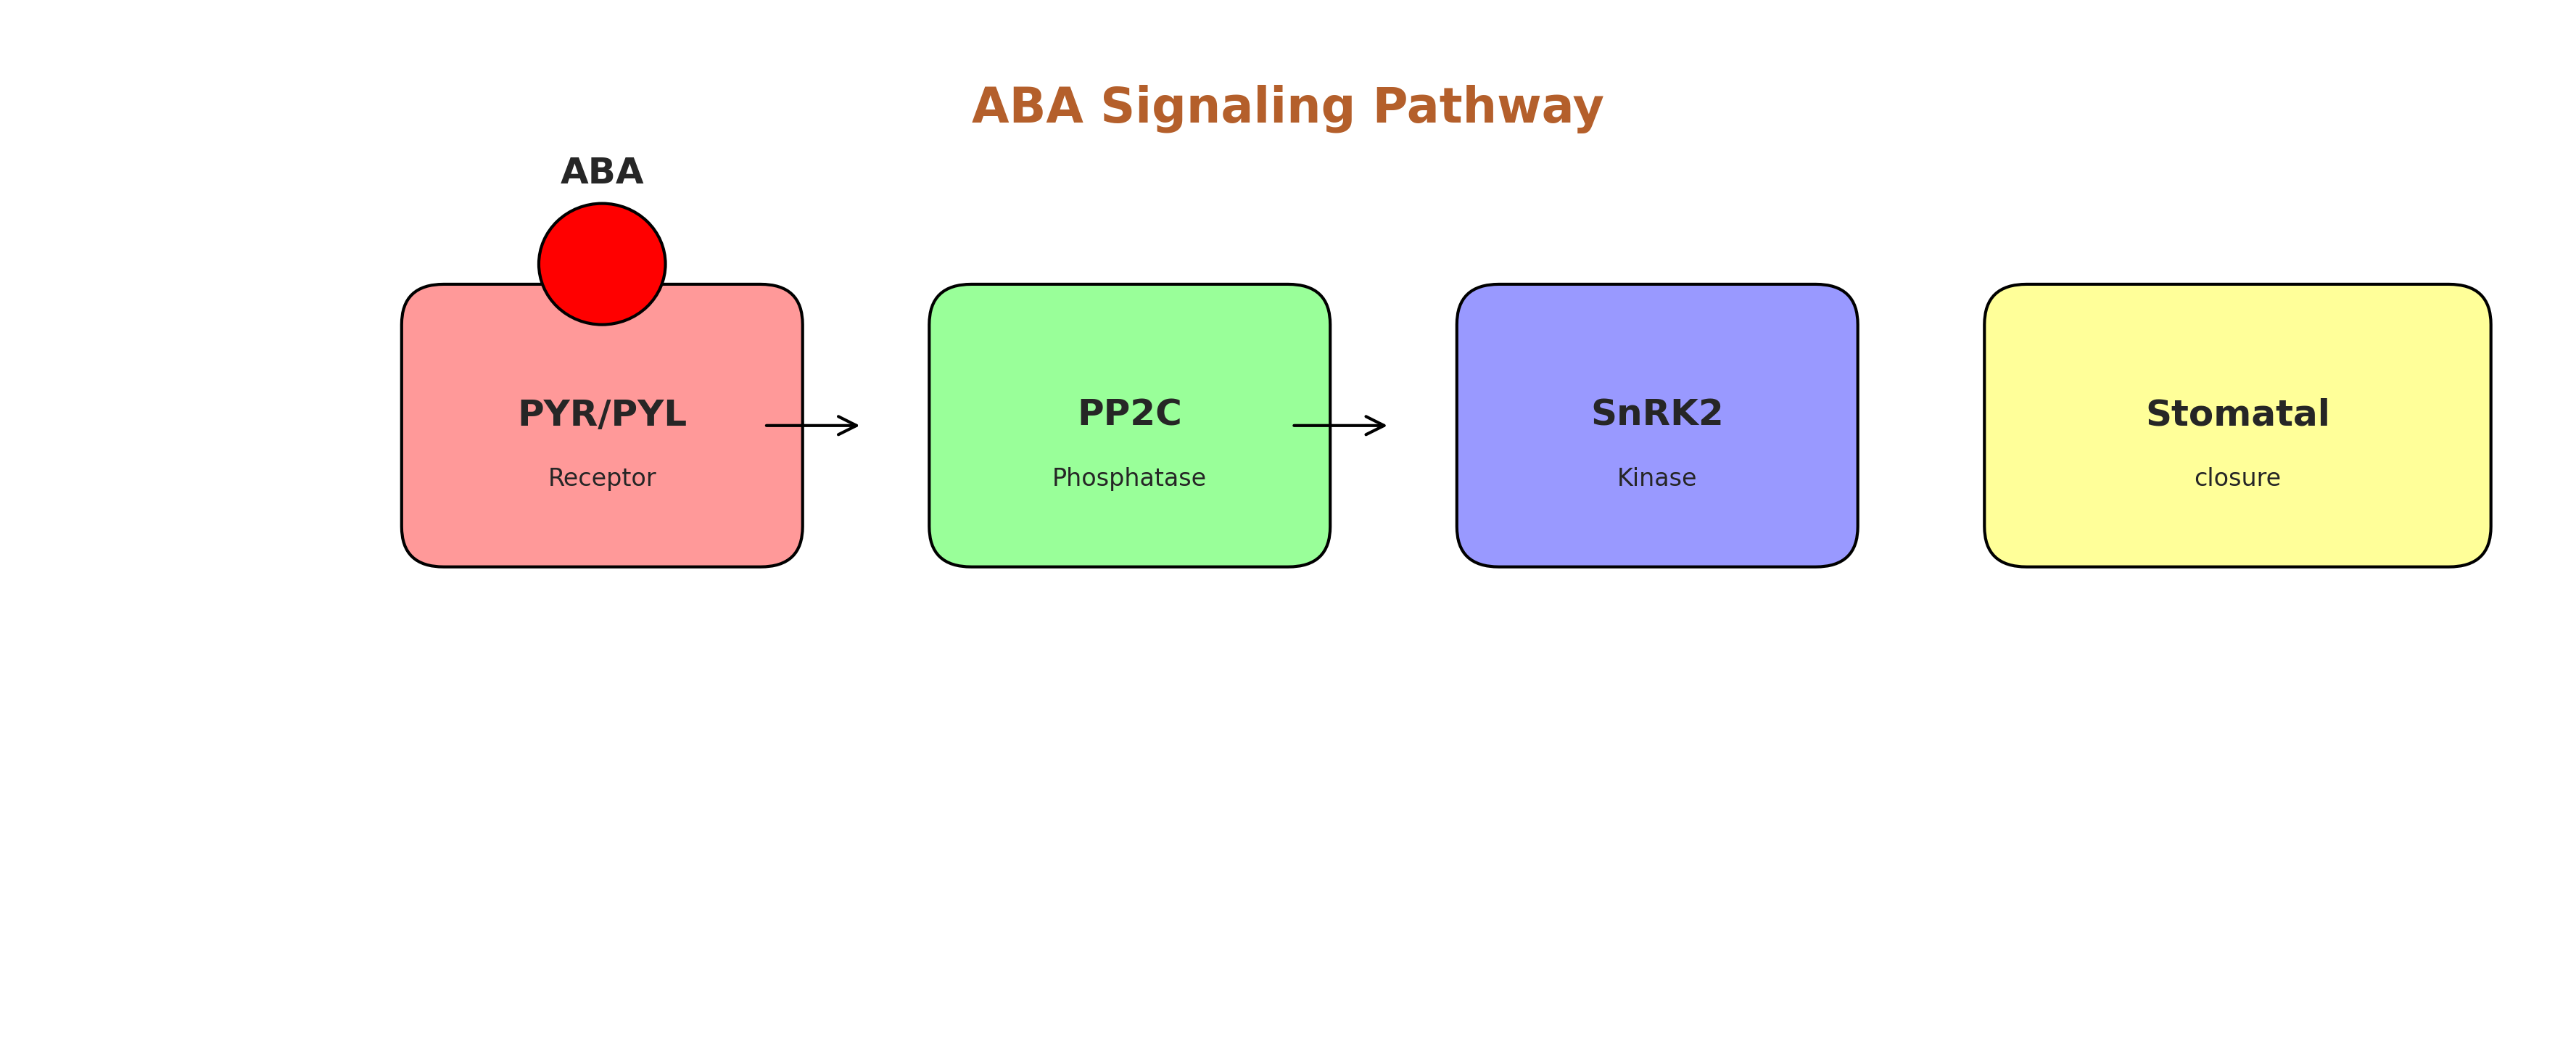
ABA Signaling Pathway
ABA binds PYR/PYL receptors, inhibits PP2C, activates SnRK2, leading to stomatal closure
images/04_09_aba_signaling.png

Jasmonate Signaling in Defense
Herbivory triggers JA synthesis, COI1 receptor activation, and defense responses
images/04_10_jasmonate_defense.png
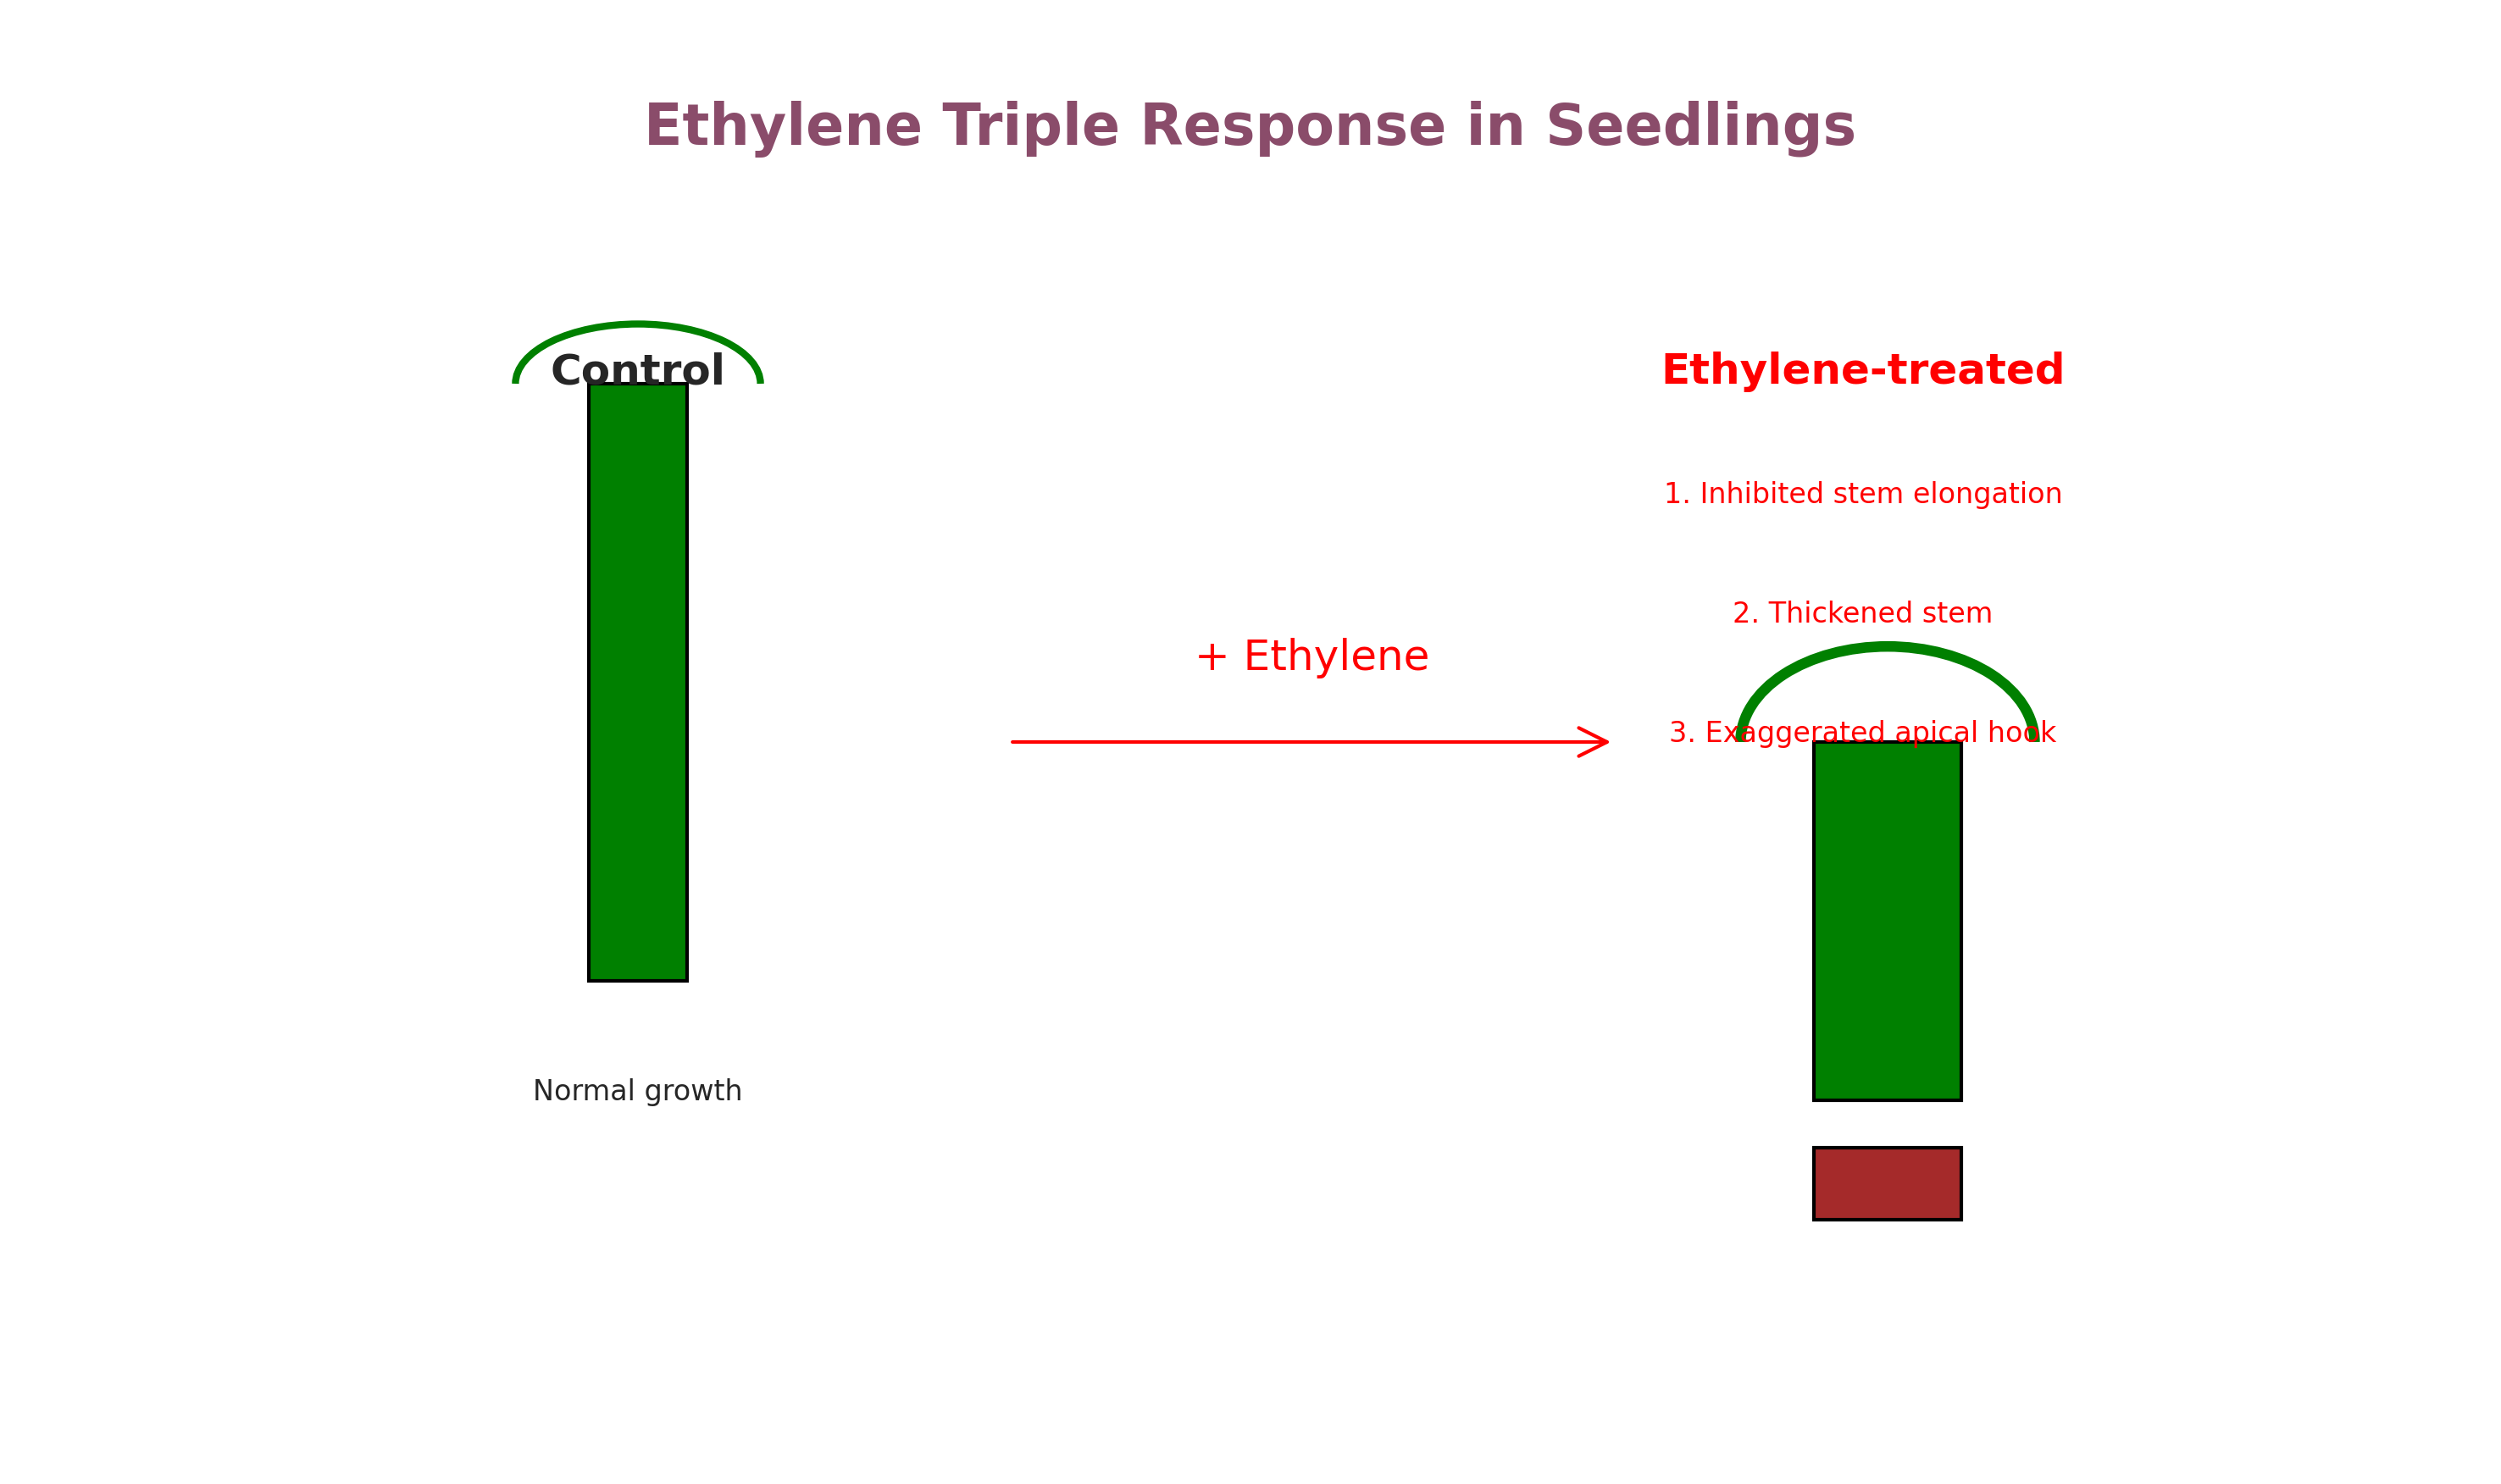
Ethylene Triple Response
Ethylene causes: inhibited stem elongation, thickened stem, exaggerated apical hook
images/04_11_ethylene_triple.png

ROS Production and Scavenging
Major ROS species (O₂⁻, H₂O₂, OH•, ¹O₂) and antioxidant enzymes (SOD, CAT, APX, GR)
images/04_12_ros_production.png
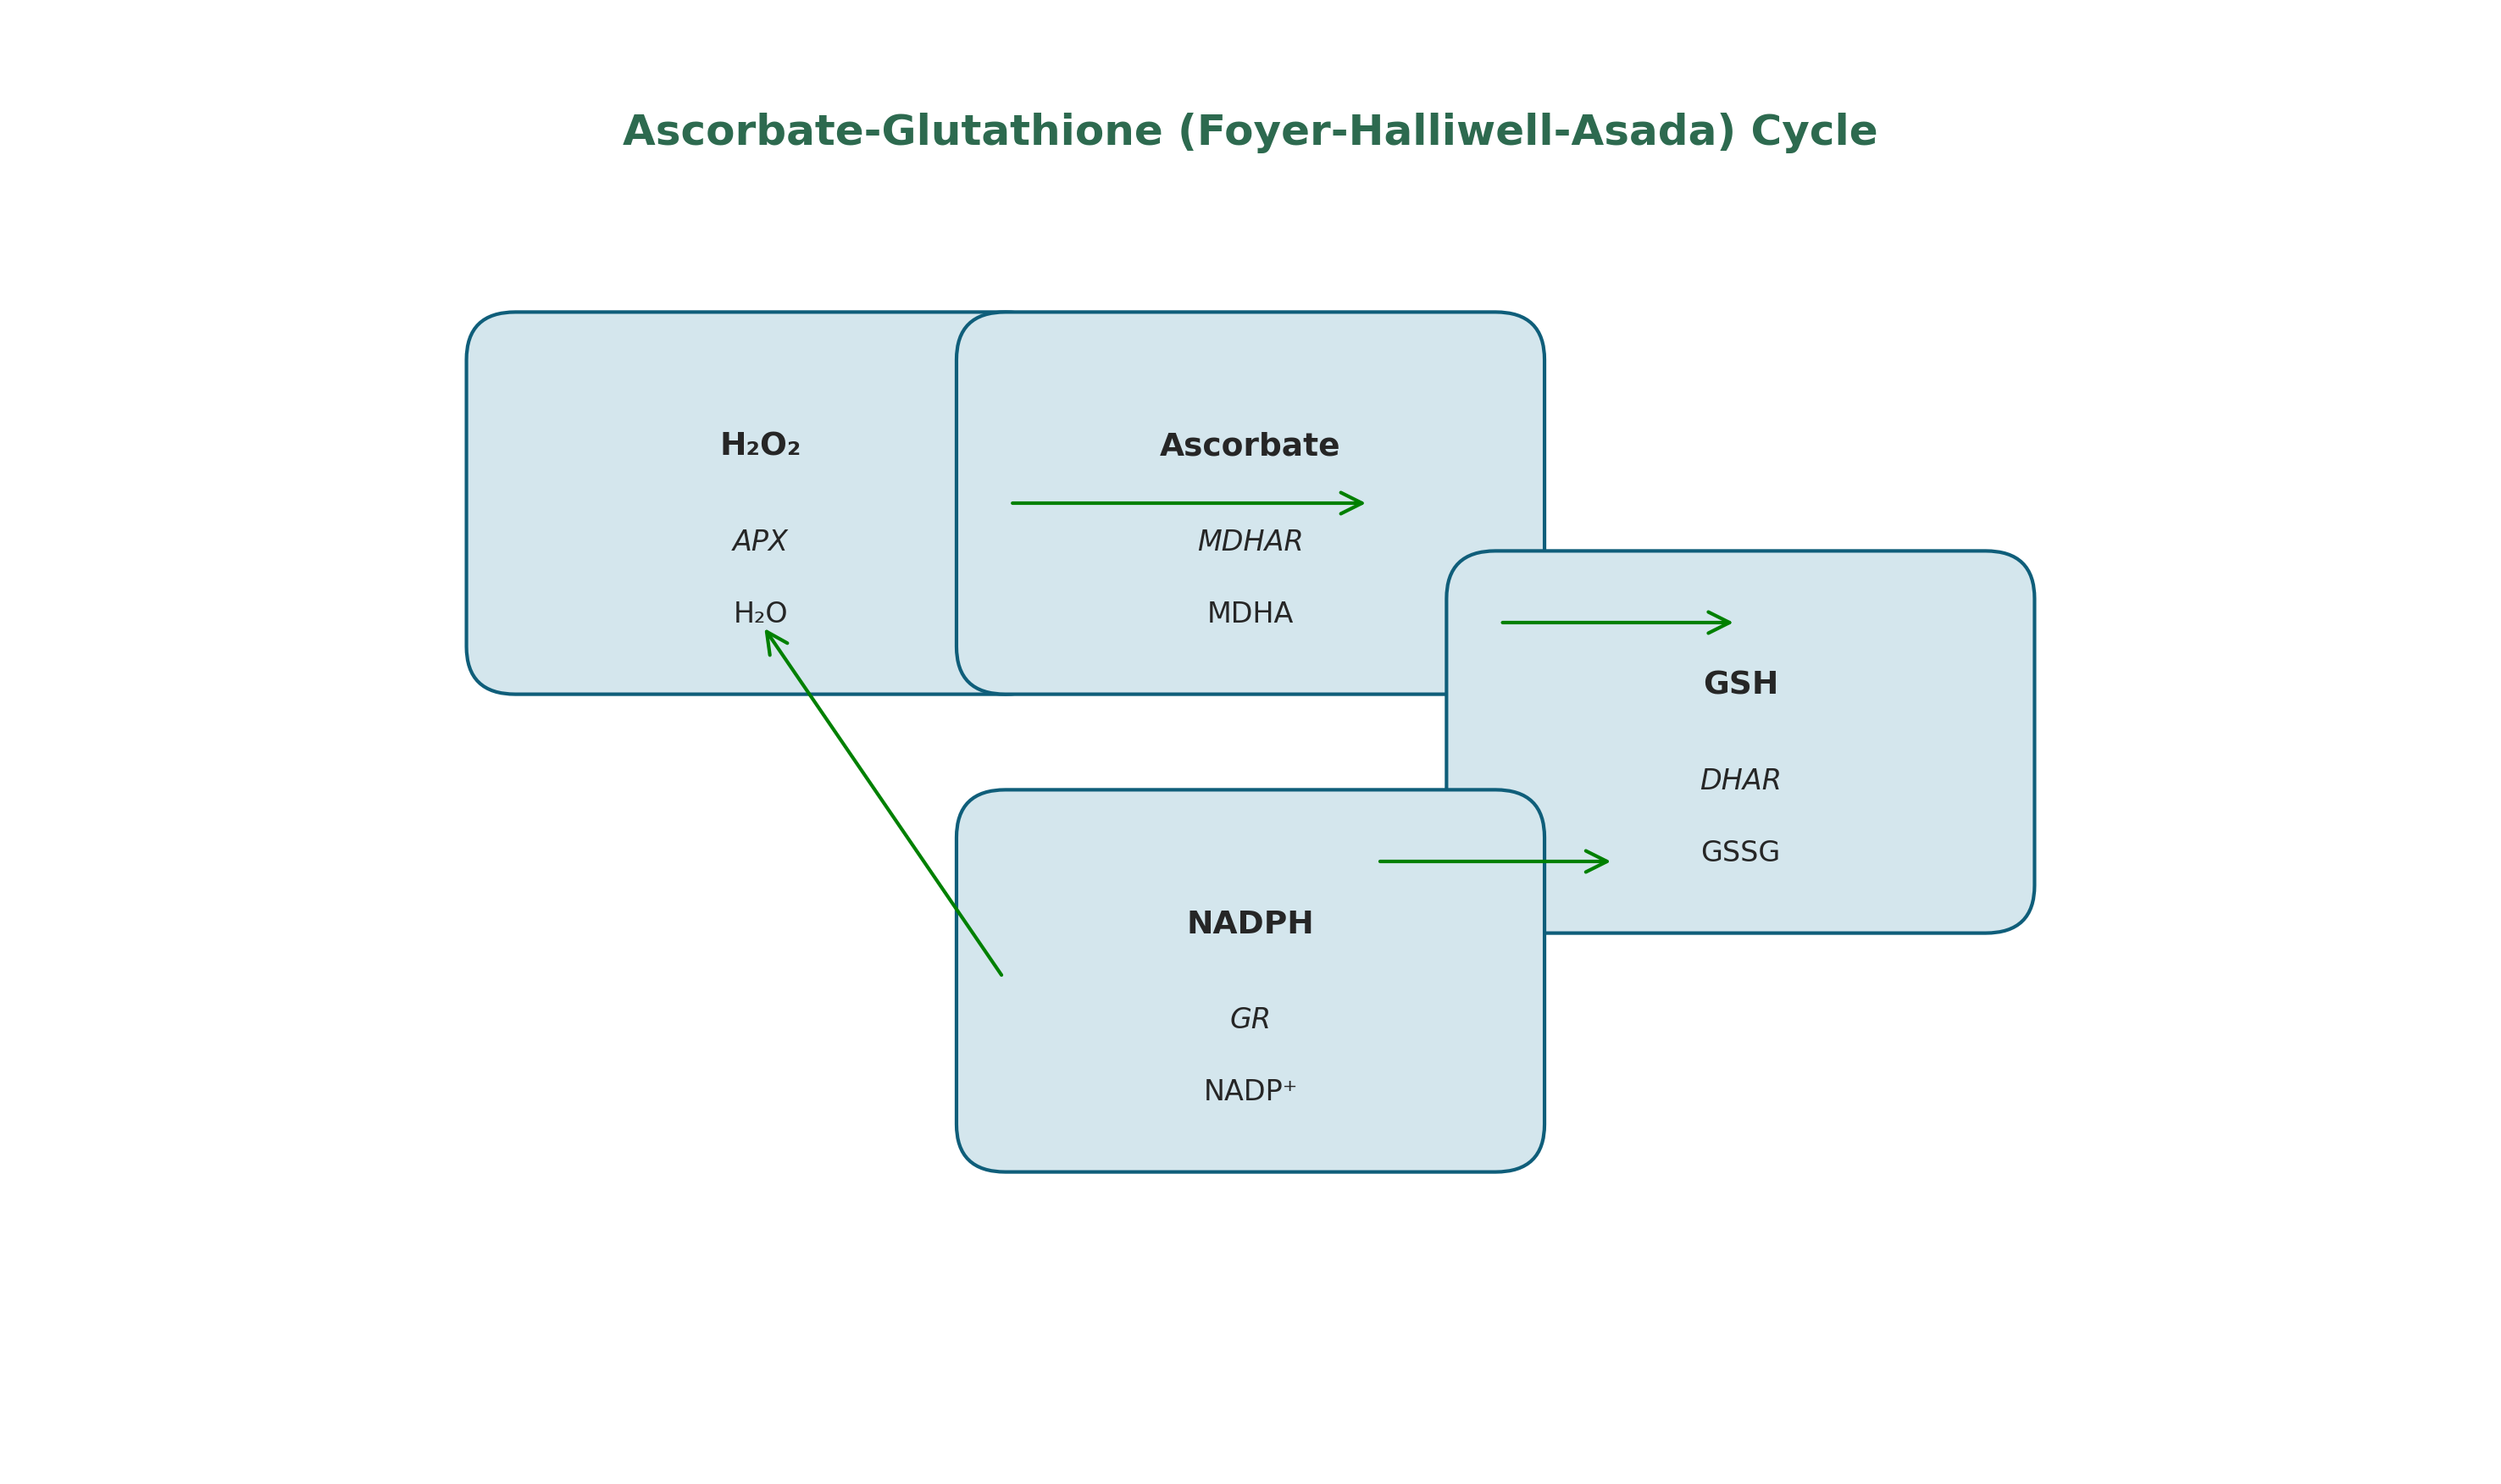
Ascorbate-Glutathione Cycle
Foyer-Halliwell-Asada cycle: APX, MDHAR, DHAR, and GR detoxify H₂O₂
images/04_13_ascorbate_glutathione.png

Stress Tolerance Strategies
Escape (early maturity), avoidance (deep roots), tolerance (osmotic adjustment)
images/04_14_stress_strategies.png

Sub1A Rice: Flood Tolerance
Sub1A gene confers submergence tolerance through metabolic quiescence
images/04_15_sub1a_rice.png

Stress Responses Summary Table
Comprehensive table of stress types, responses, signaling, and horticultural relevance
images/04_16_stress_summary.png
🔬 Module V · Analytical & Biochemical Techniques

Laboratory Safety Equipment
PPE and safety gear: lab coat, goggles, gloves, safety shower
images/05_01_lab_safety.png

Common Laboratory Glassware
Beaker, Erlenmeyer flask, volumetric flask, graduated cylinder, pipette
images/05_02_lab_glassware.png
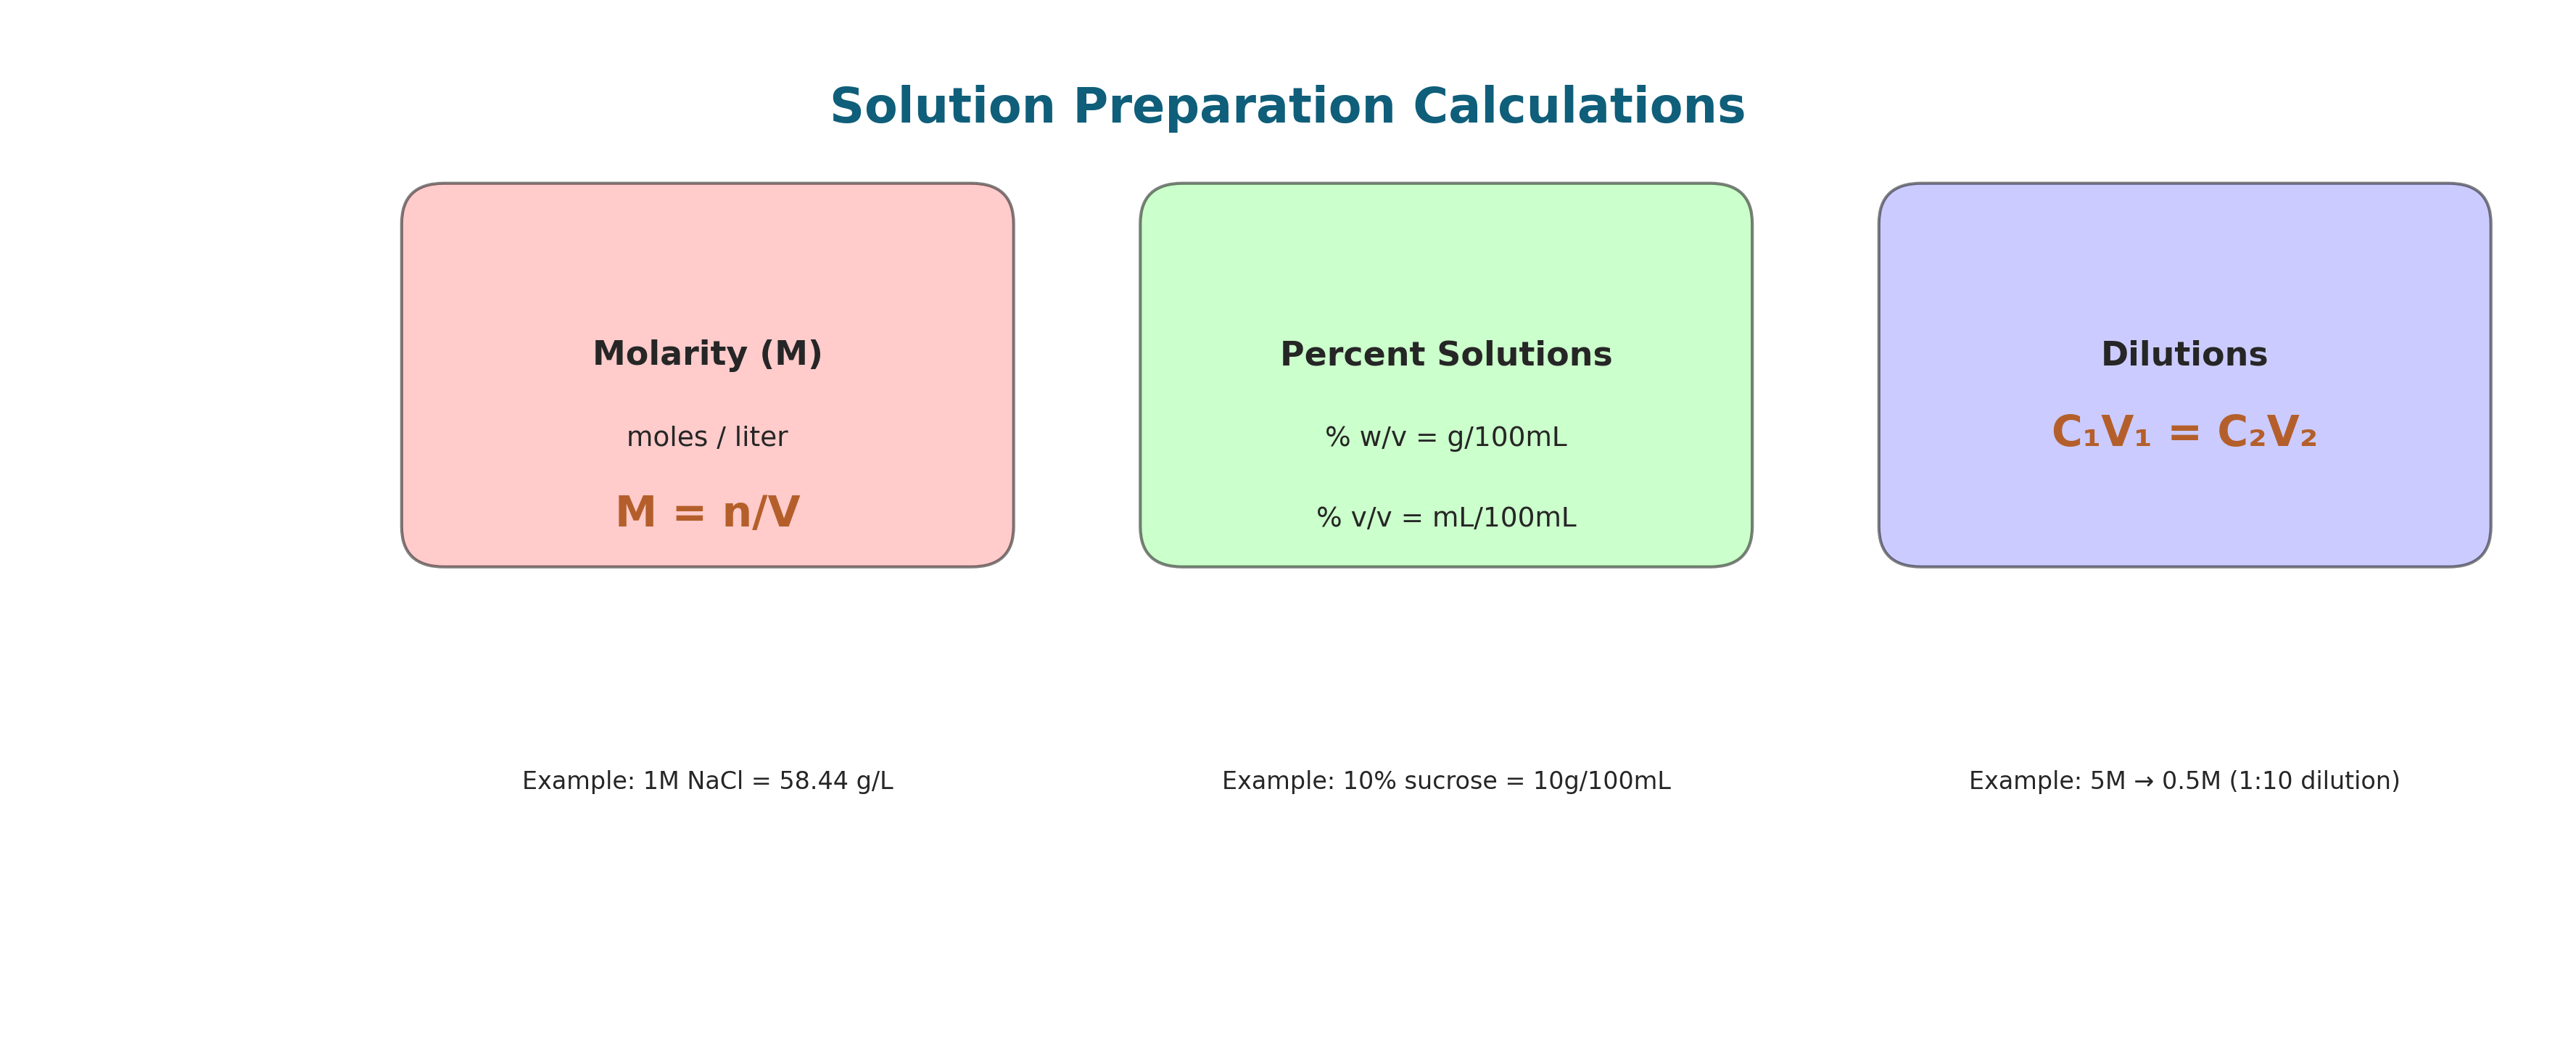
Solution Preparation Calculations
Molarity (M = n/V), percent solutions (% w/v, % v/v), dilutions (C₁V₁ = C₂V₂)
images/05_03_solution_prep.png
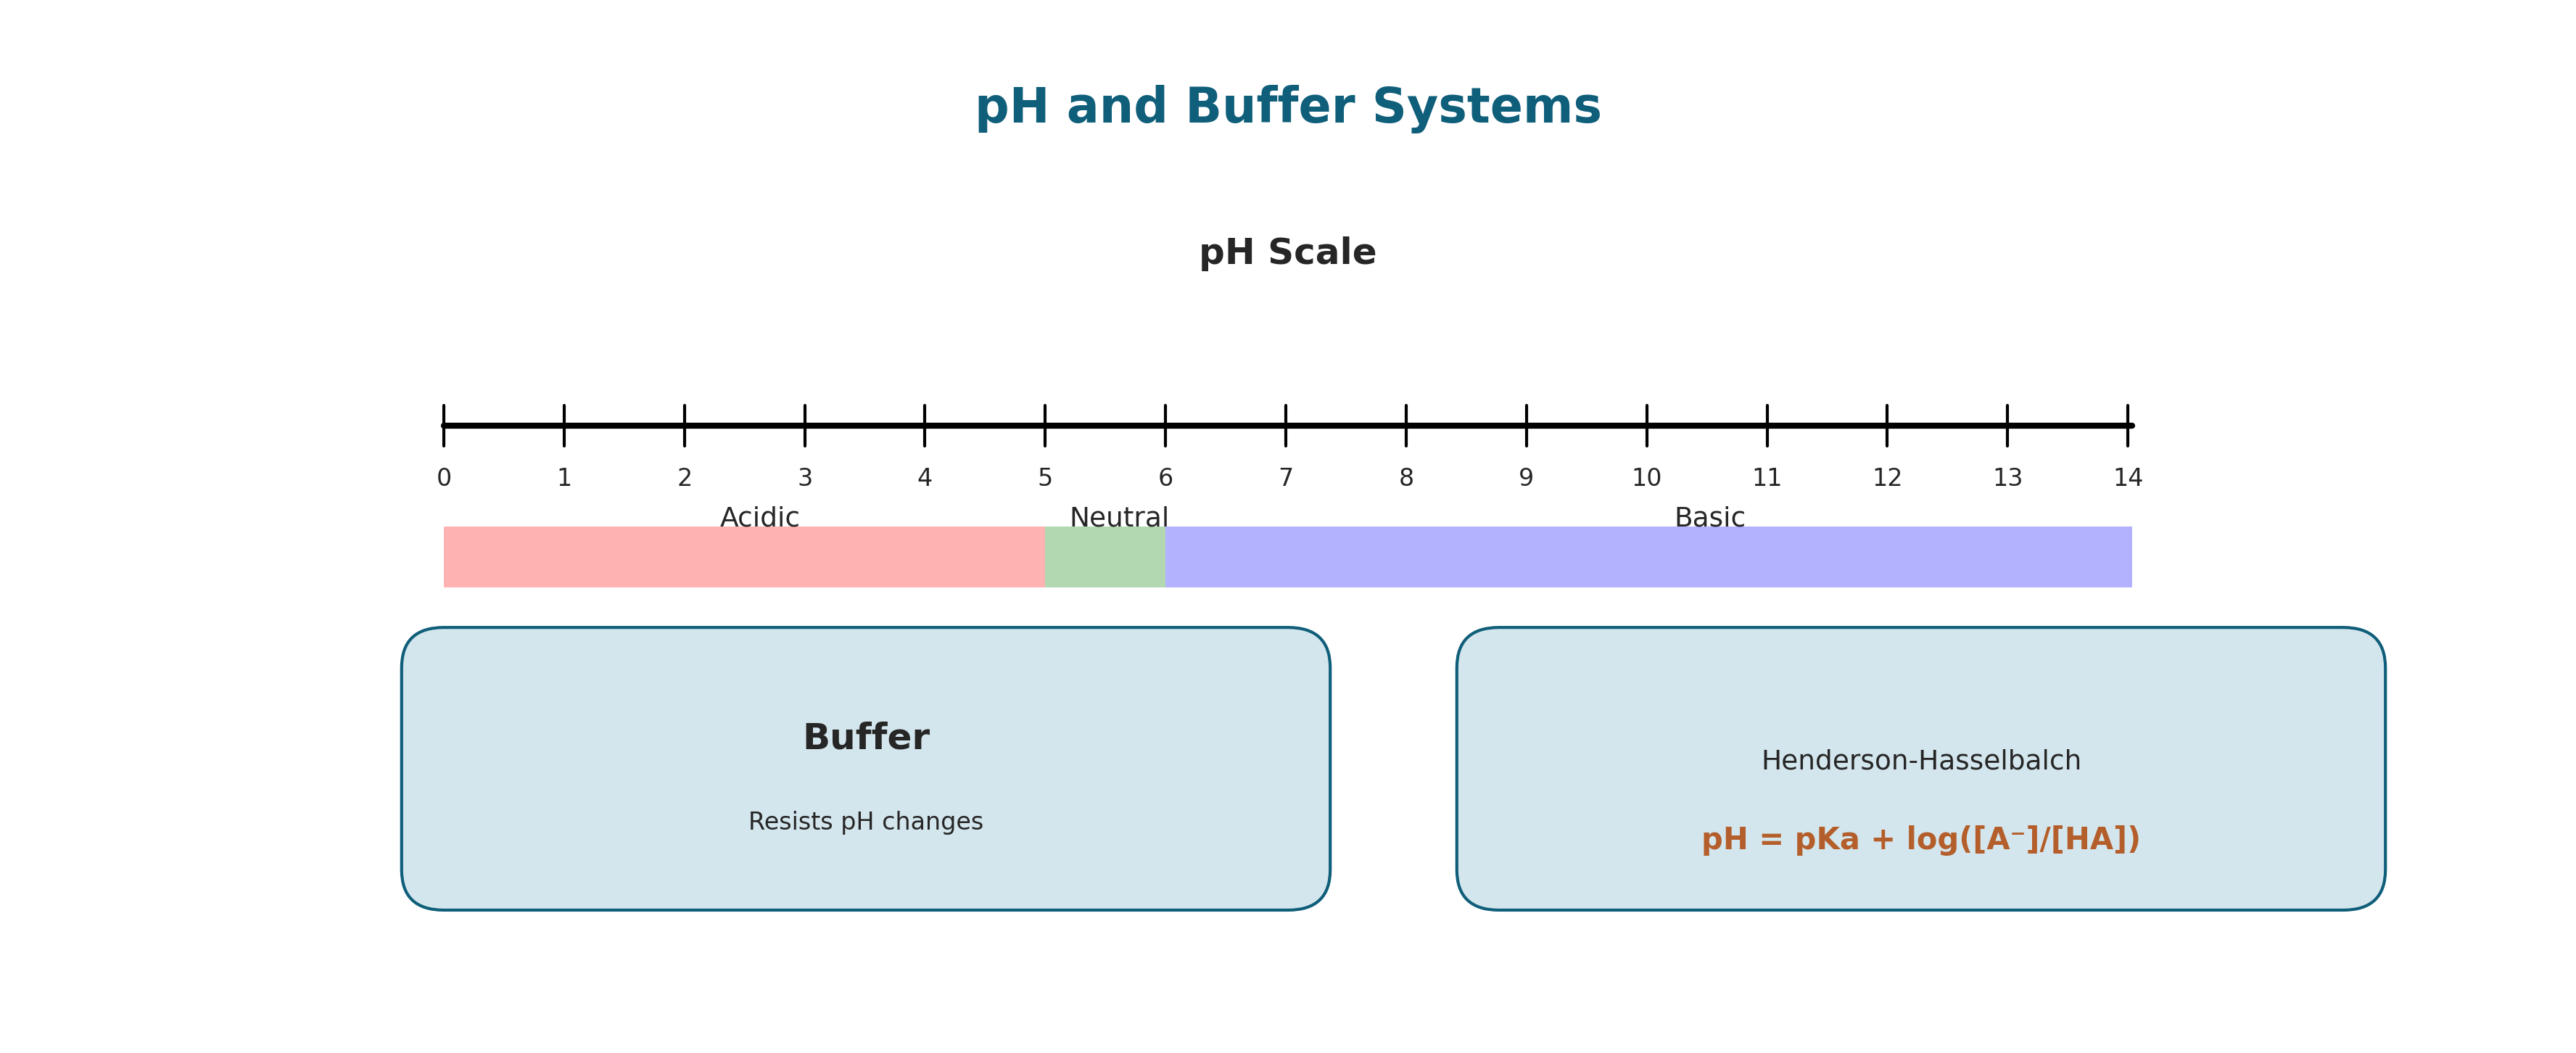
pH and Buffer Systems
pH scale (0-14), buffer definition, Henderson-Hasselbalch equation
images/05_04_ph_buffers.png

Spectrophotometer Components
Light source, monochromator, sample cuvette, detector, display
images/05_05_spectrophotometer.png

Absorption Spectrum of Chlorophyll
Chlorophyll a and b absorption peaks at 430 nm and 660 nm
images/05_06_absorption_spectrum.png

Standard Curve for Protein Assay
Bradford assay standard curve with BSA standards and unknown determination
images/05_07_standard_curve.png

Paper Chromatography
Separation of plant pigments with Rf value calculation
images/05_08_paper_chromatography.png

Thin Layer Chromatography (TLC)
Silica gel plate with sample lanes and standards
images/05_09_tlc.png

High Performance Liquid Chromatography (HPLC)
Components: solvent, pump, injector, column, detector with chromatogram
images/05_10_hplc.png
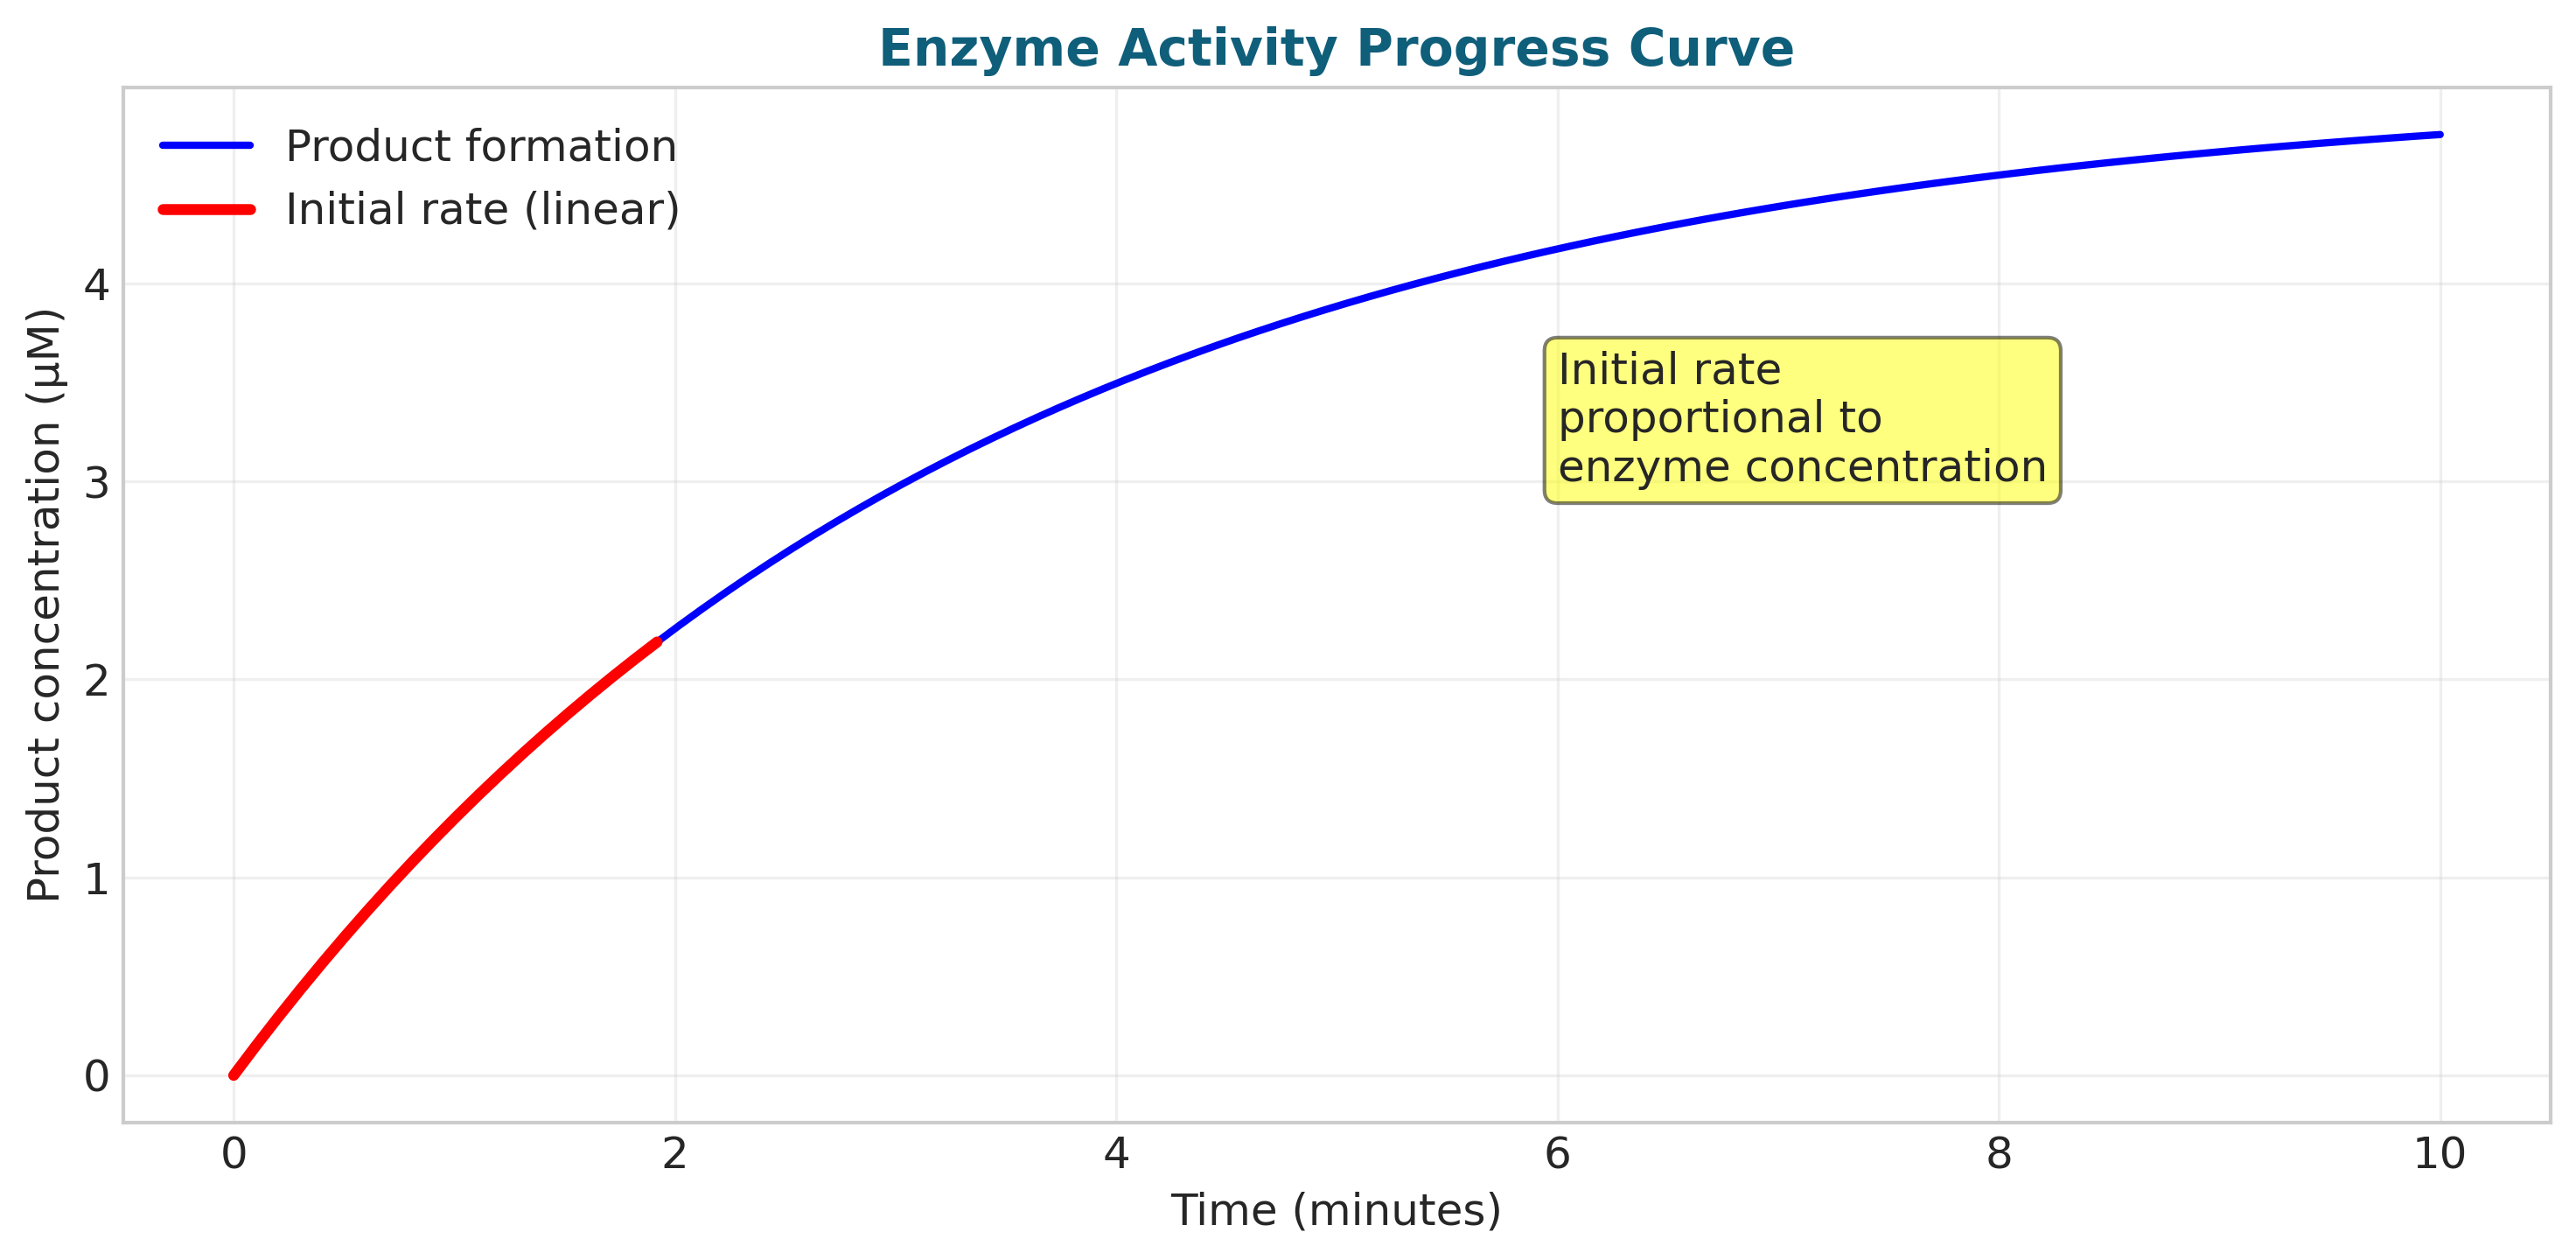
Enzyme Progress Curve
Product formation over time with initial linear rate
images/05_11_progress_curve.png

Enzyme Unit (U) Definition
1 U = 1 μmol product/min, specific activity = U/mg protein
images/05_12_enzyme_unit.png

Enzyme Kinetics: Michaelis-Menten and Lineweaver-Burk
Vmax and Km determination from Michaelis-Menten and double reciprocal plots
images/05_13_enzyme_kinetics.png
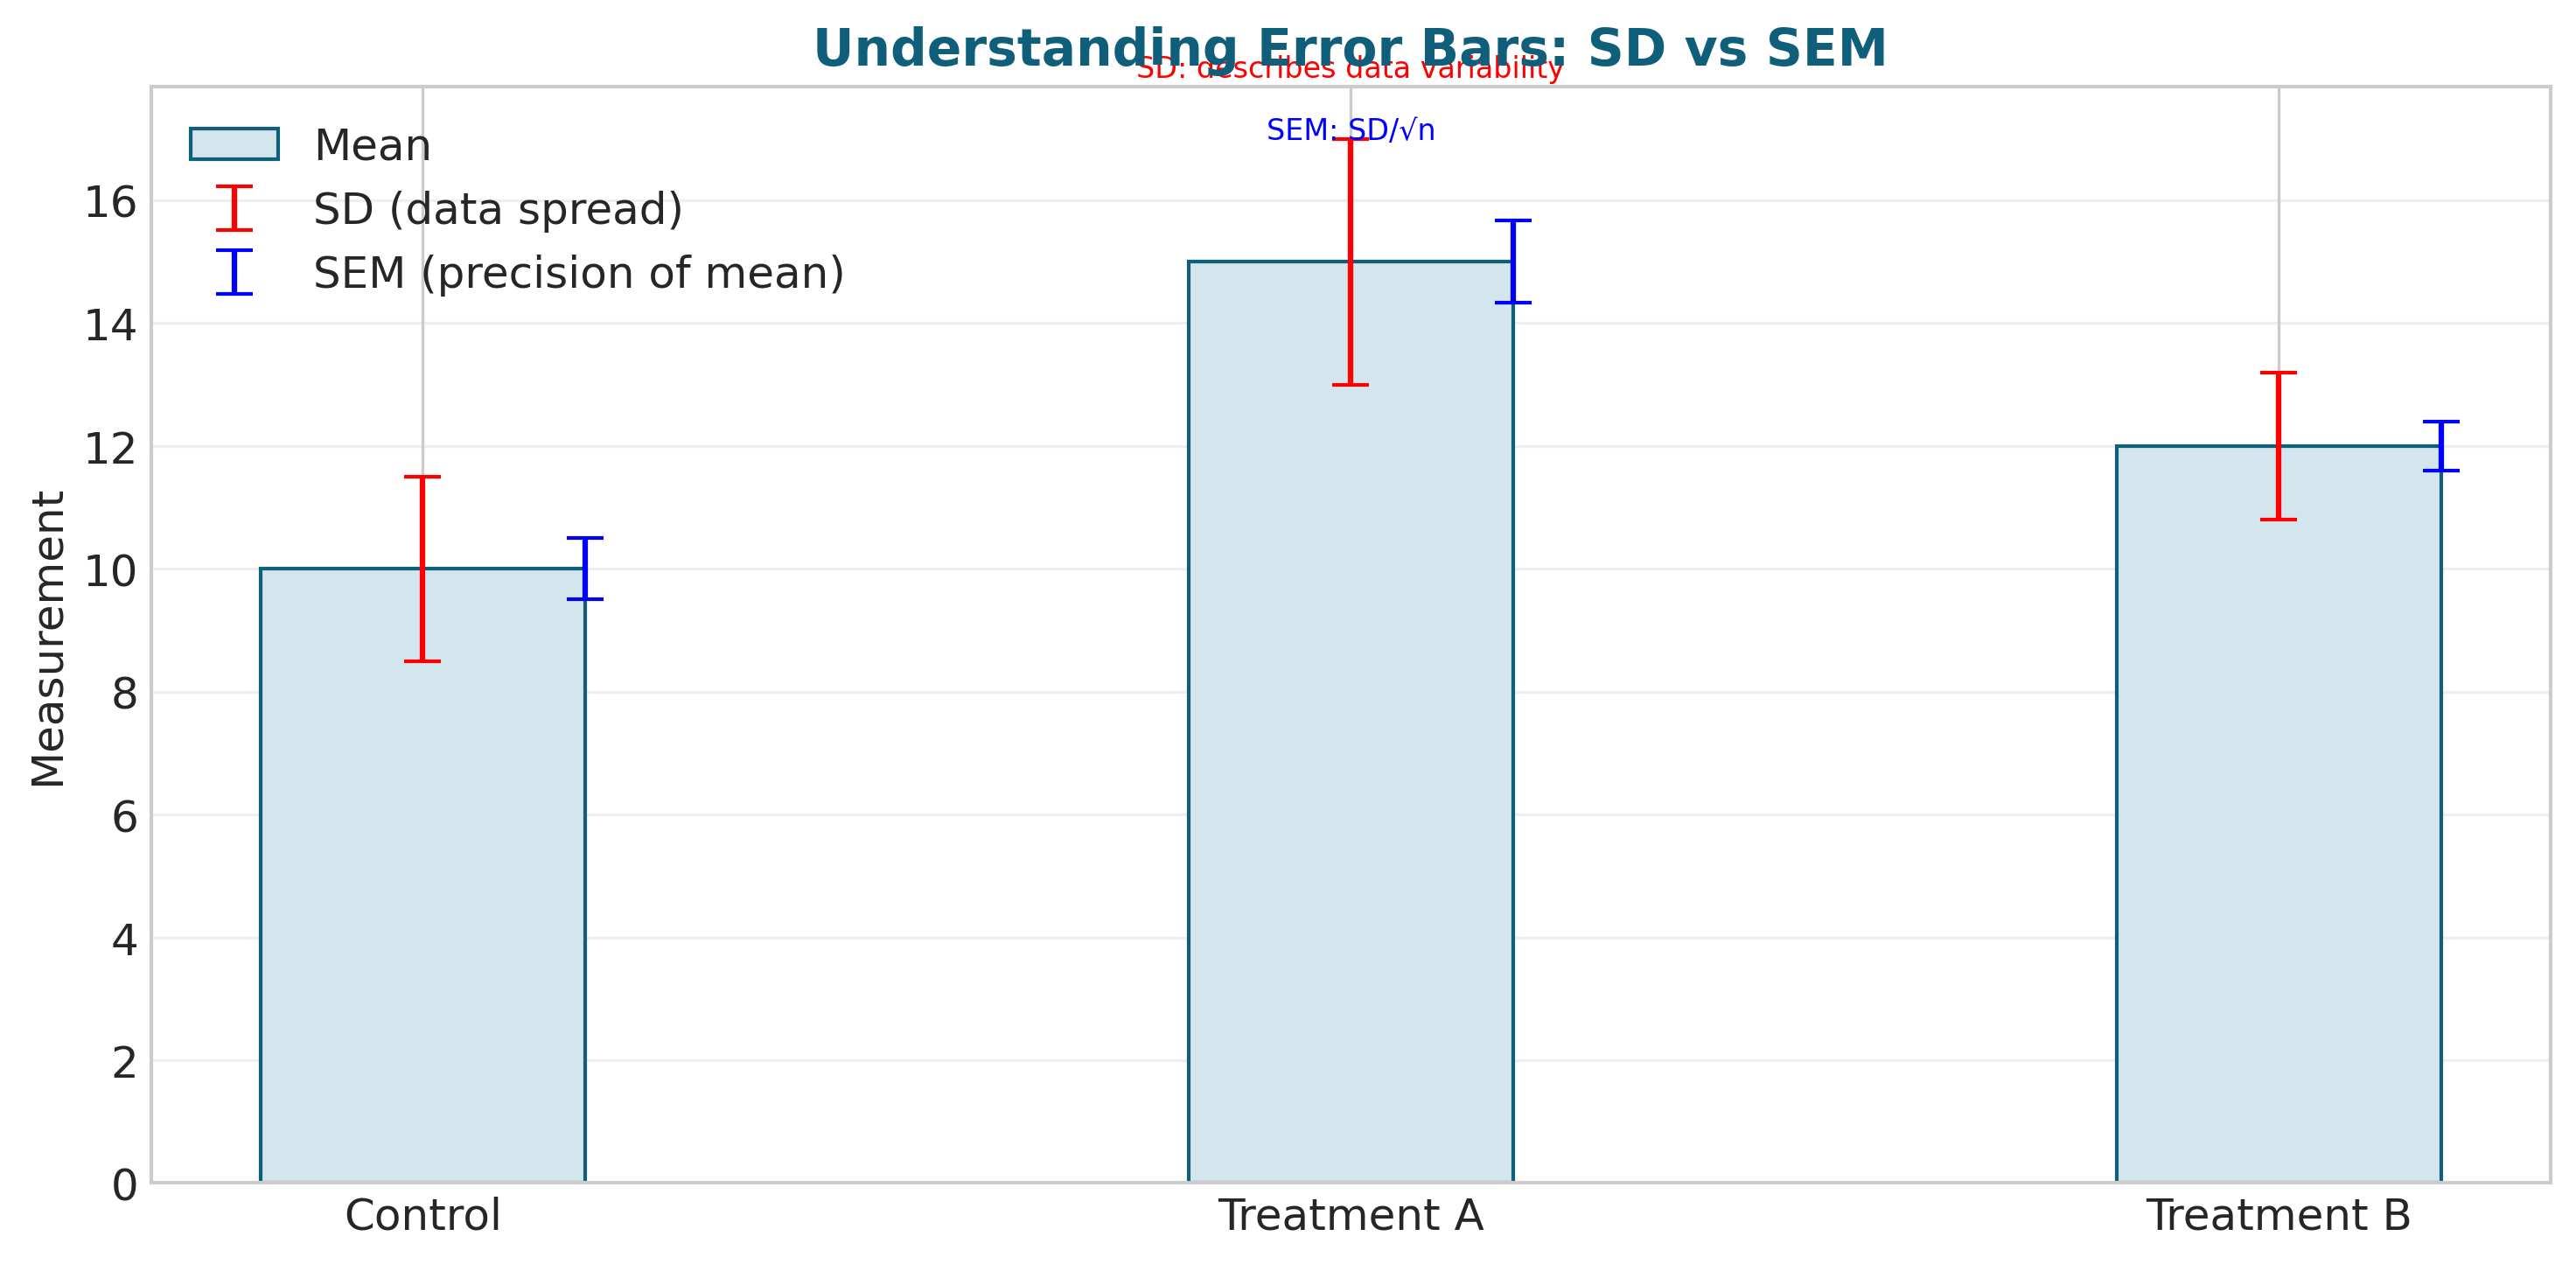
Error Bars: SD vs SEM
Standard deviation (data spread) vs standard error (precision of mean)
images/05_14_error_bars.png
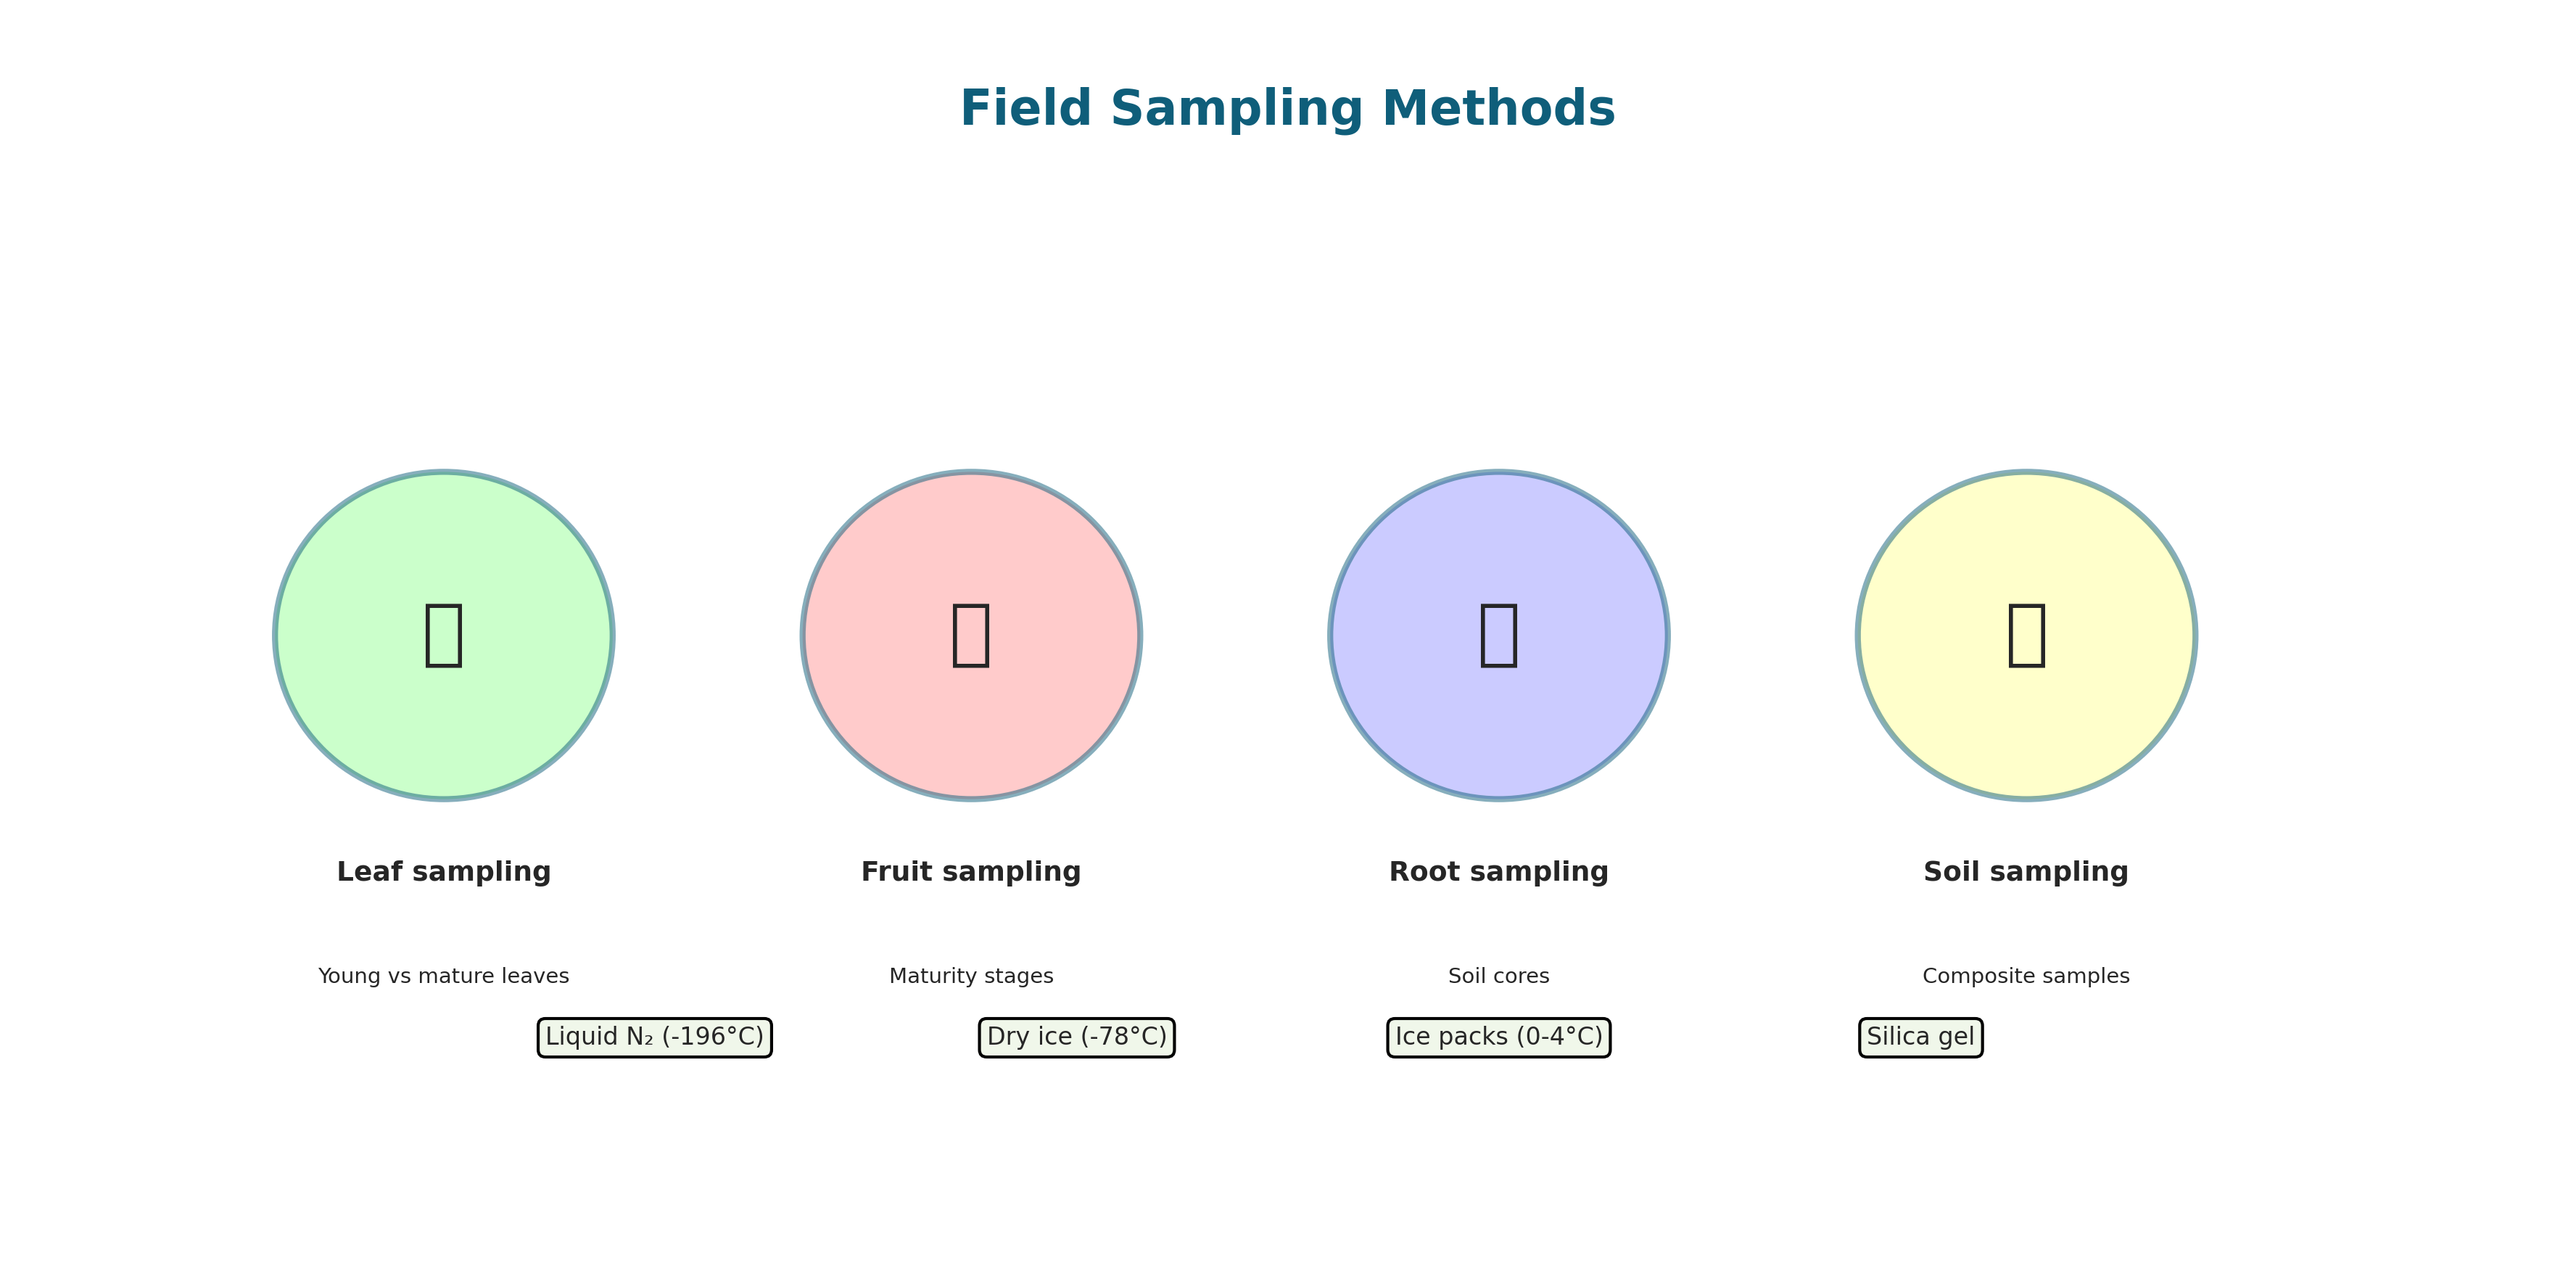
Field Sampling Methods
Leaf, fruit, root, and soil sampling techniques with preservation methods
images/05_15_field_sampling.png
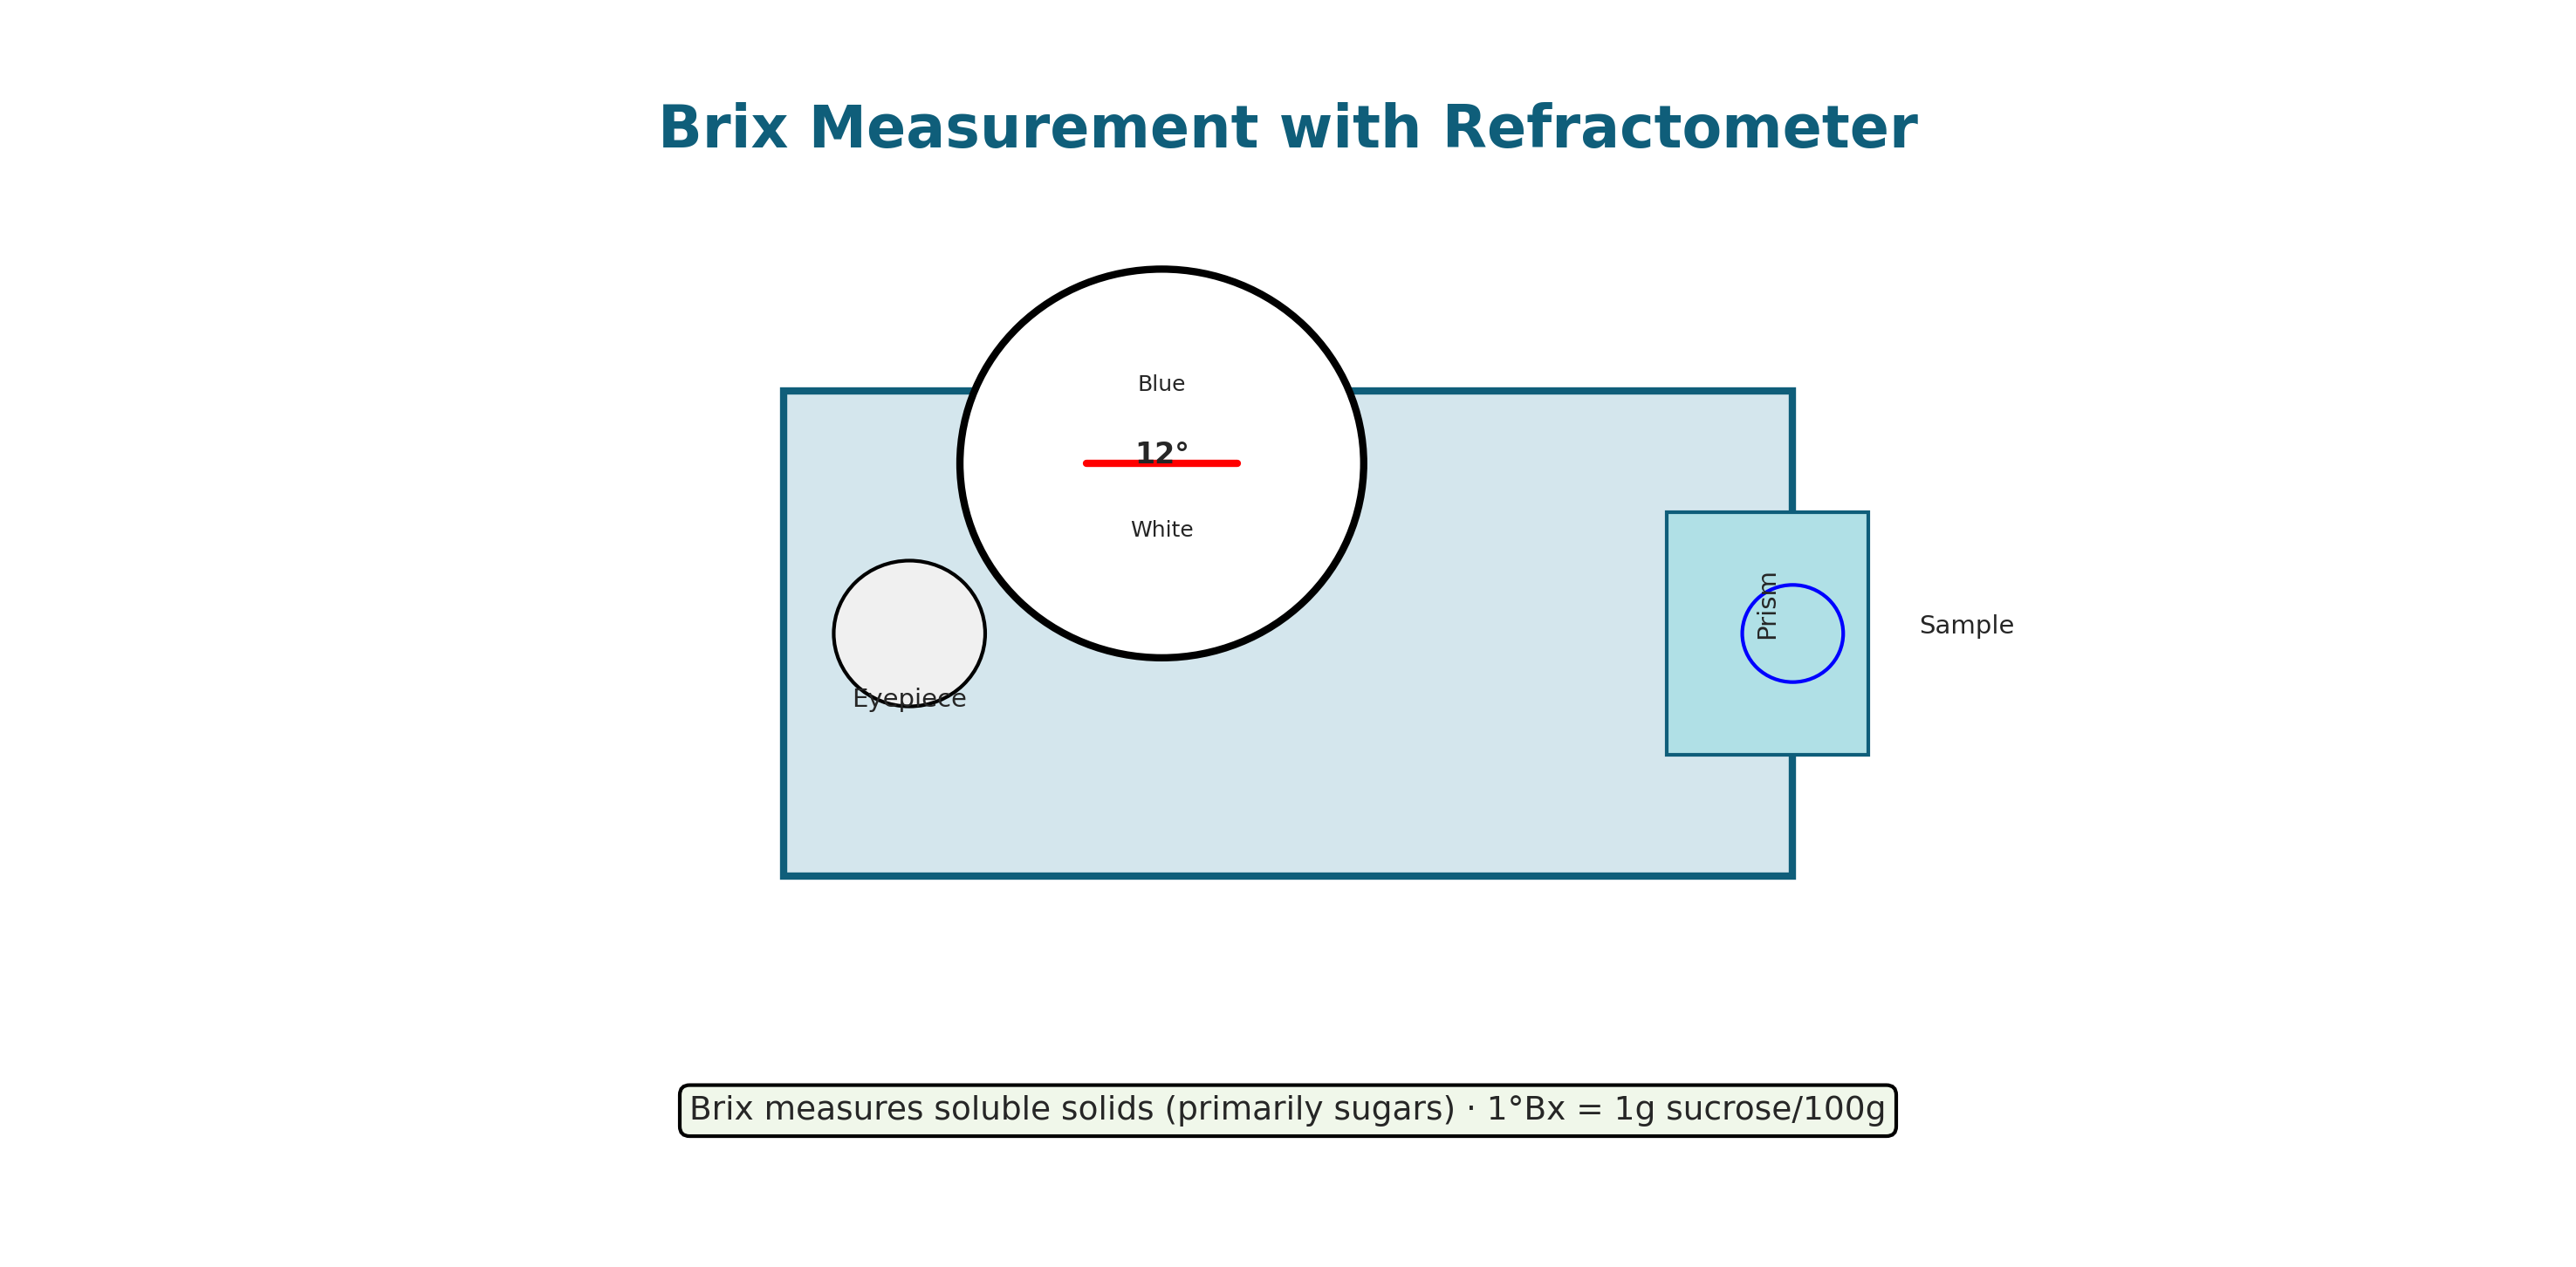
Brix Measurement with Refractometer
Handheld refractometer for measuring soluble solids (sugars) in fruits
images/05_16_brix_refractometer.png

Titration Setup for Acidity
Burette with NaOH, sample with indicator, endpoint color change
images/05_17_titration.png
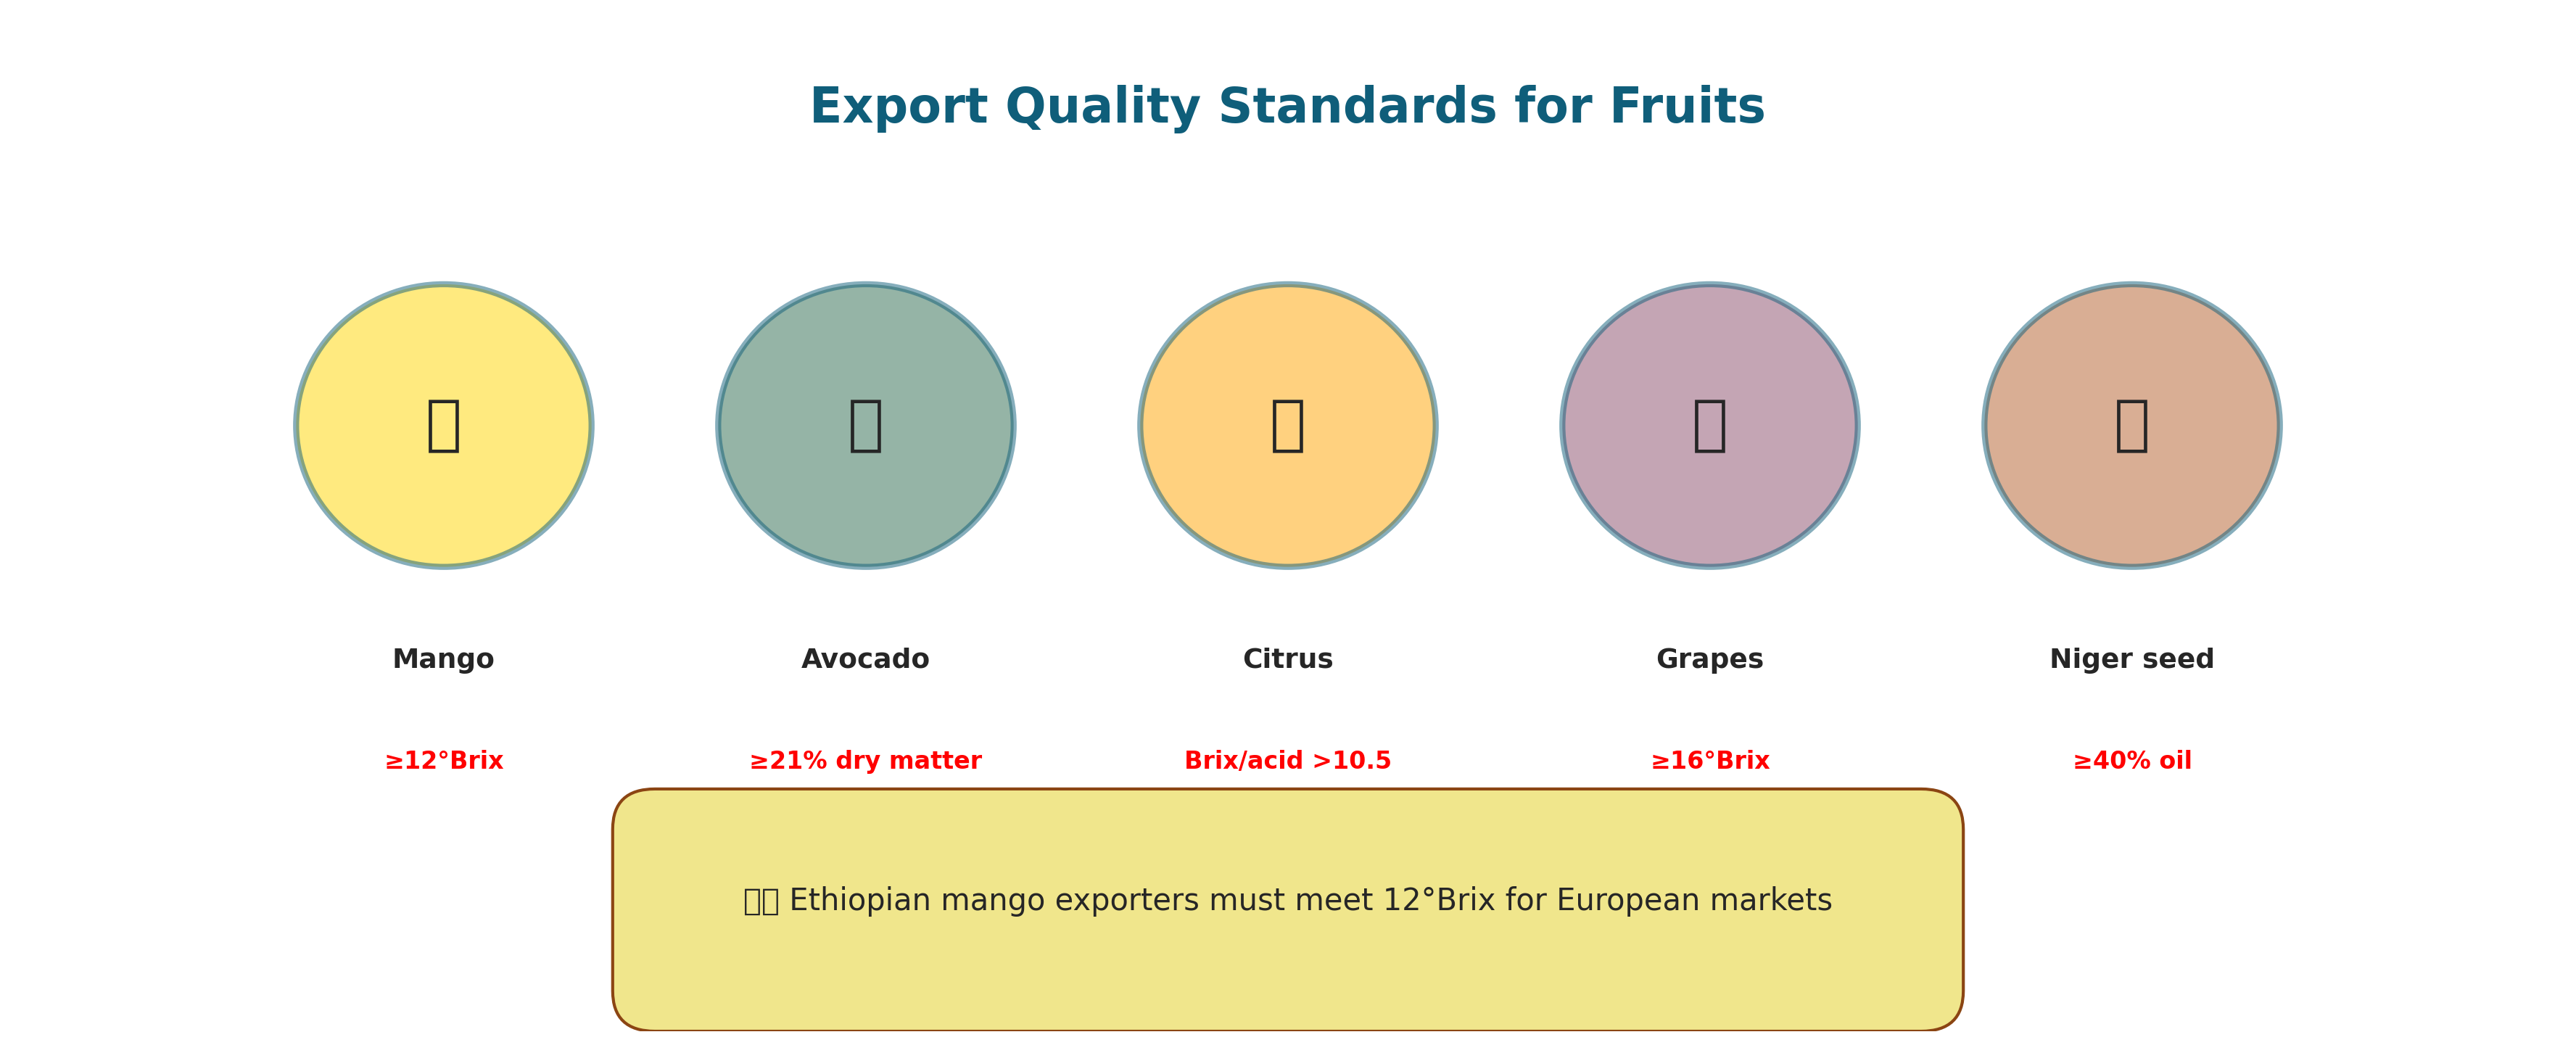
Export Quality Standards
Minimum quality requirements: mango (12°Brix), avocado (21% dry matter), citrus (Brix/acid >10.5)
images/05_18_export_standards.png
🇪🇹 Module VI · Ethiopian Case Studies

Coffee Cherry Structure
Cross-section showing skin, pulp, parchment, and bean (endosperm)
images/06_01_coffee_cherry.png

Caffeine Biosynthesis Pathway
Xanthosine → 7-methylxanthosine → theobromine → caffeine via N-methyltransferases
images/06_02_caffeine_biosynthesis.png
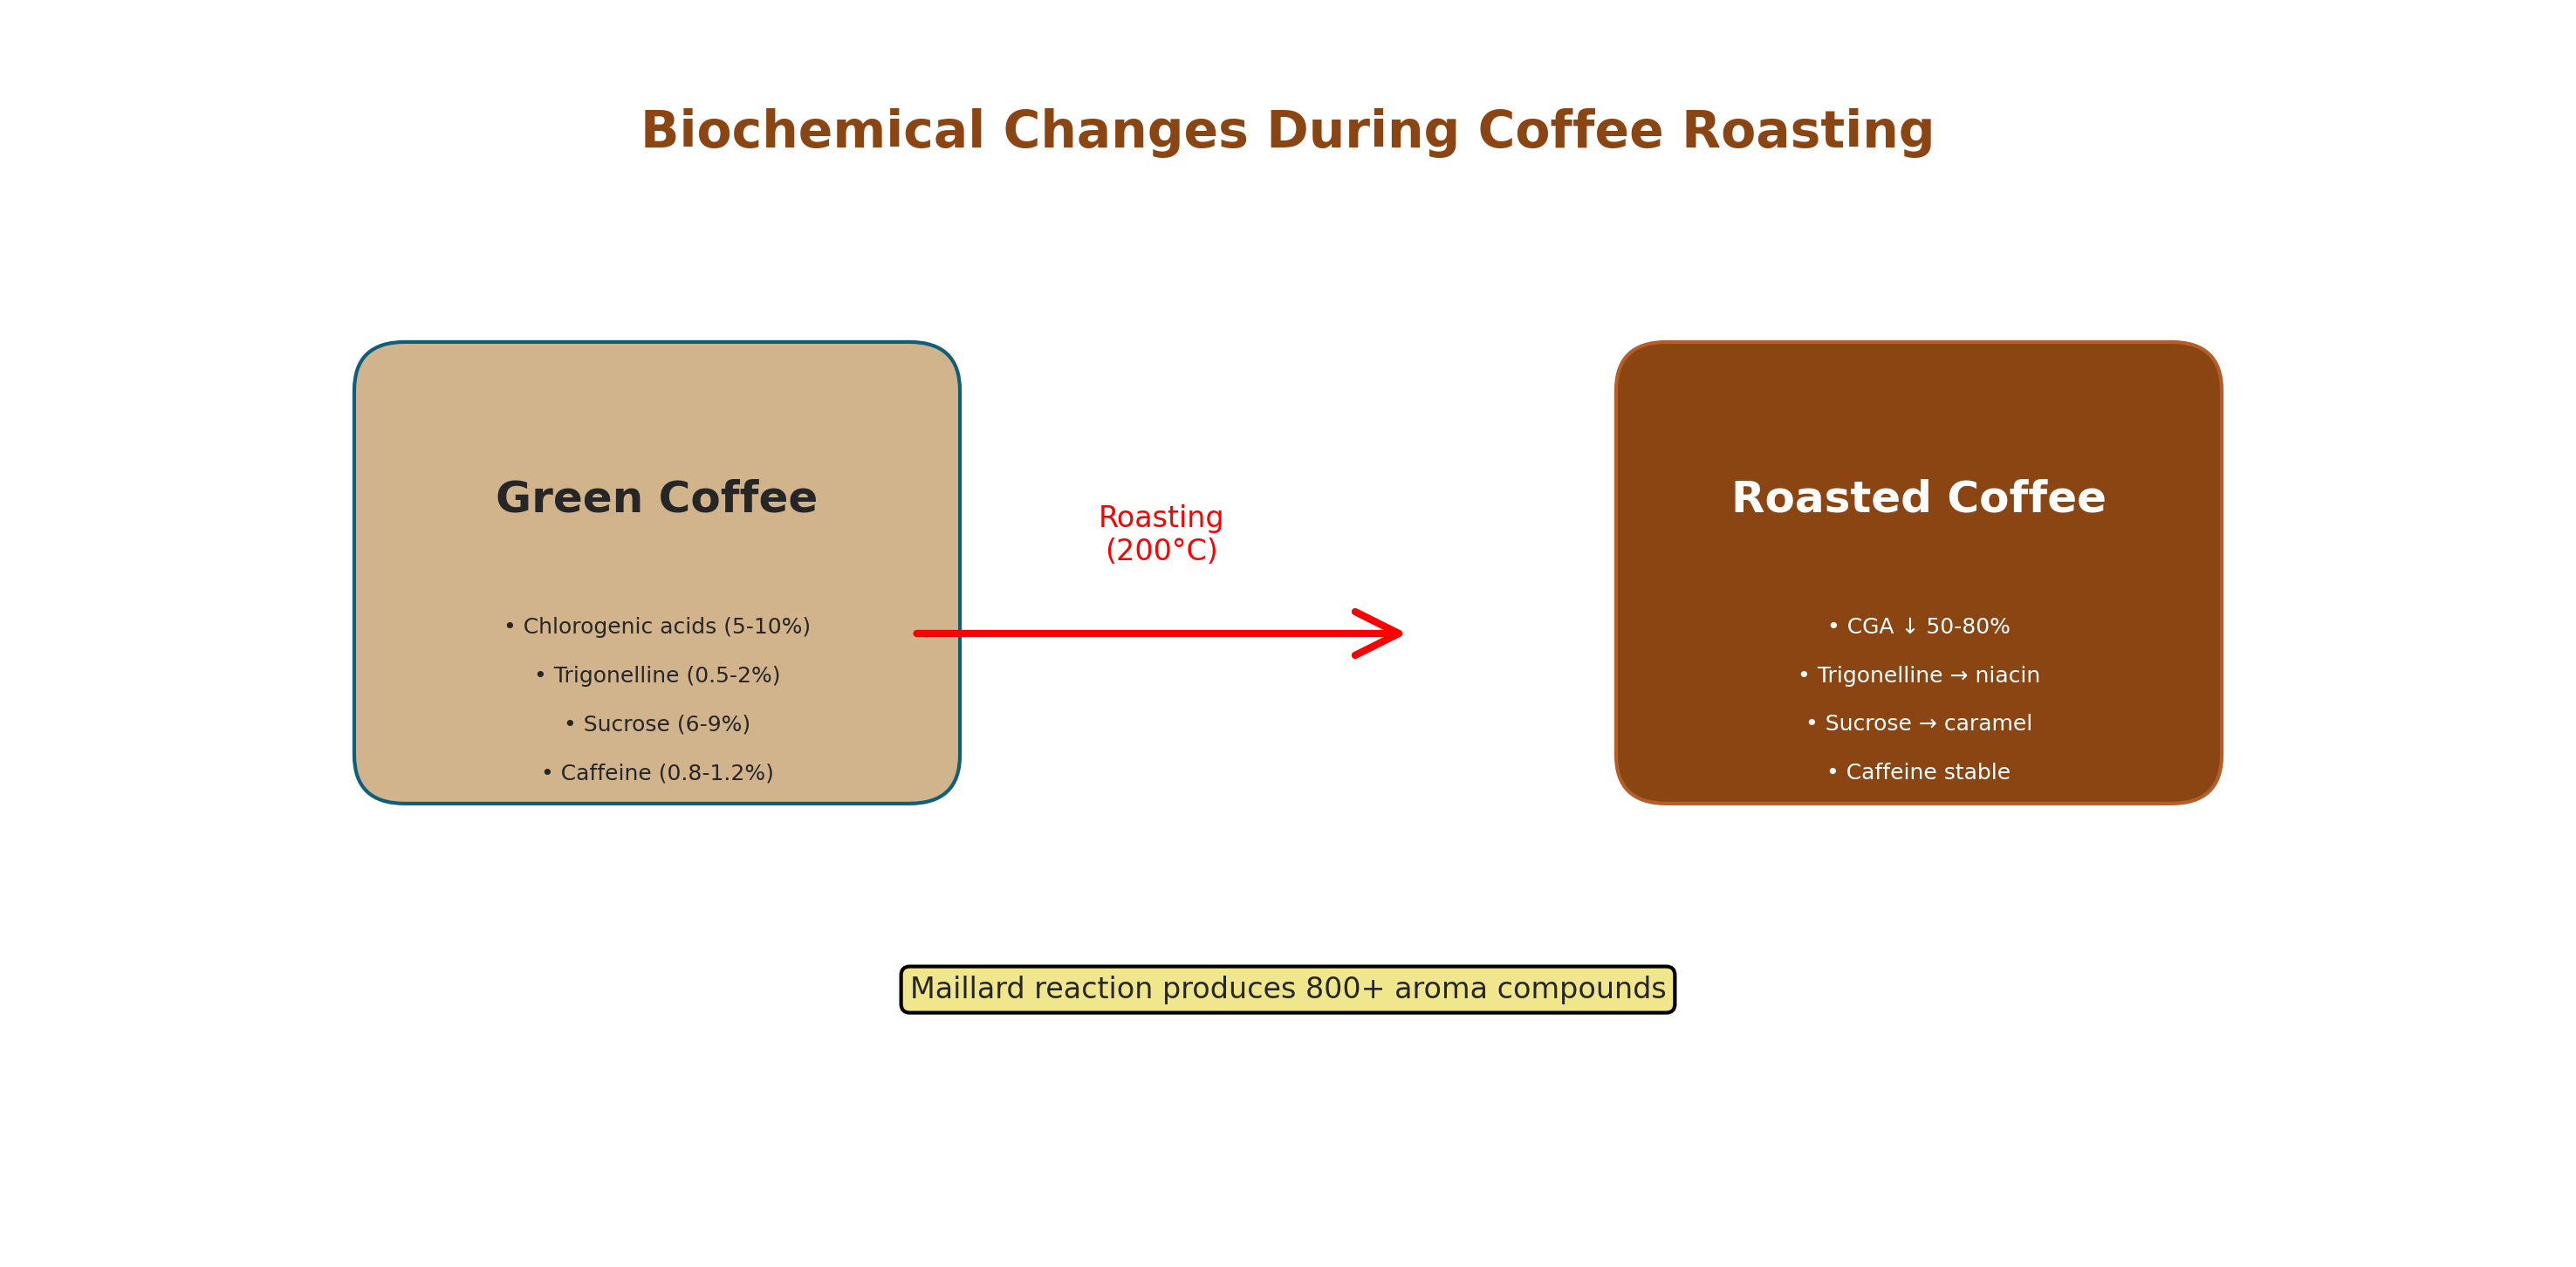
Biochemical Changes During Coffee Roasting
Green vs roasted coffee: CGA↓, trigonelline→niacin, sucrose caramelization
images/06_03_coffee_roasting.png

Ethiopian Coffee Regions
Yirgacheffe, Sidama, Jimma, Hararge, Nekemte with characteristic flavor profiles
images/06_04_coffee_regions.png

Enset (False Banana) Plant Structure
Pseudostem, corm, roots and products: kocho, bulla, amicho
images/06_05_enset_plant.png

Enset Fermentation Process
Harvest → scraping → pit fermentation → kneading → kocho/bulla (pH 5.7→3.8)
images/06_06_enset_fermentation.png

Microbial Dynamics in Enset Fermentation
LAB increase, Enterobacteriaceae decrease, pH drops during 42-day fermentation
images/06_07_enset_microbial.png
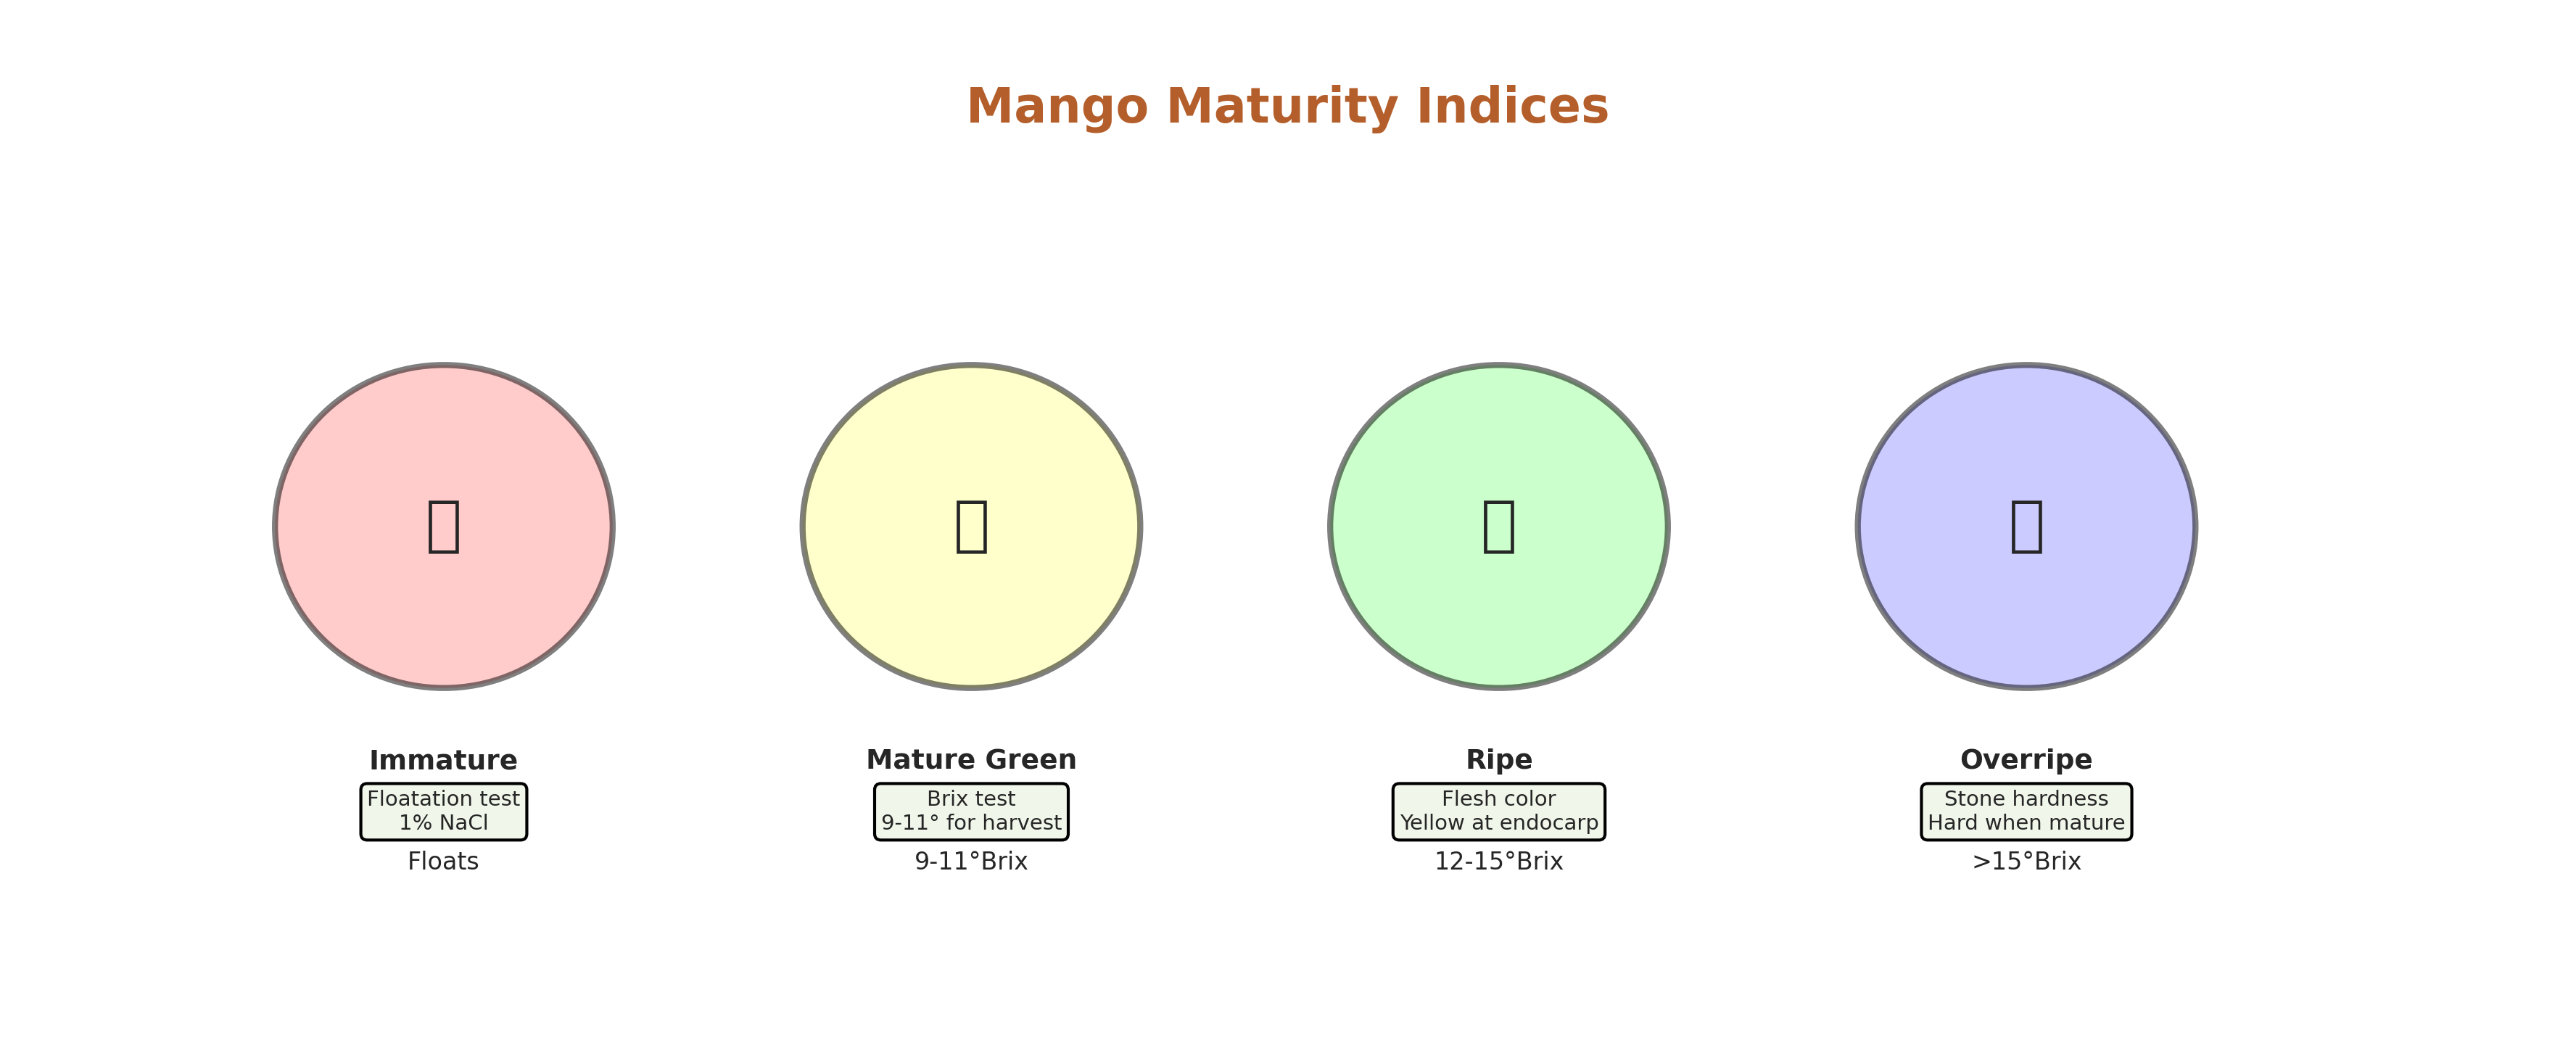
Mango Maturity Indices
Immature, mature green (9-11°Brix), ripe (12-15°Brix), overripe stages
images/06_08_mango_maturity.png
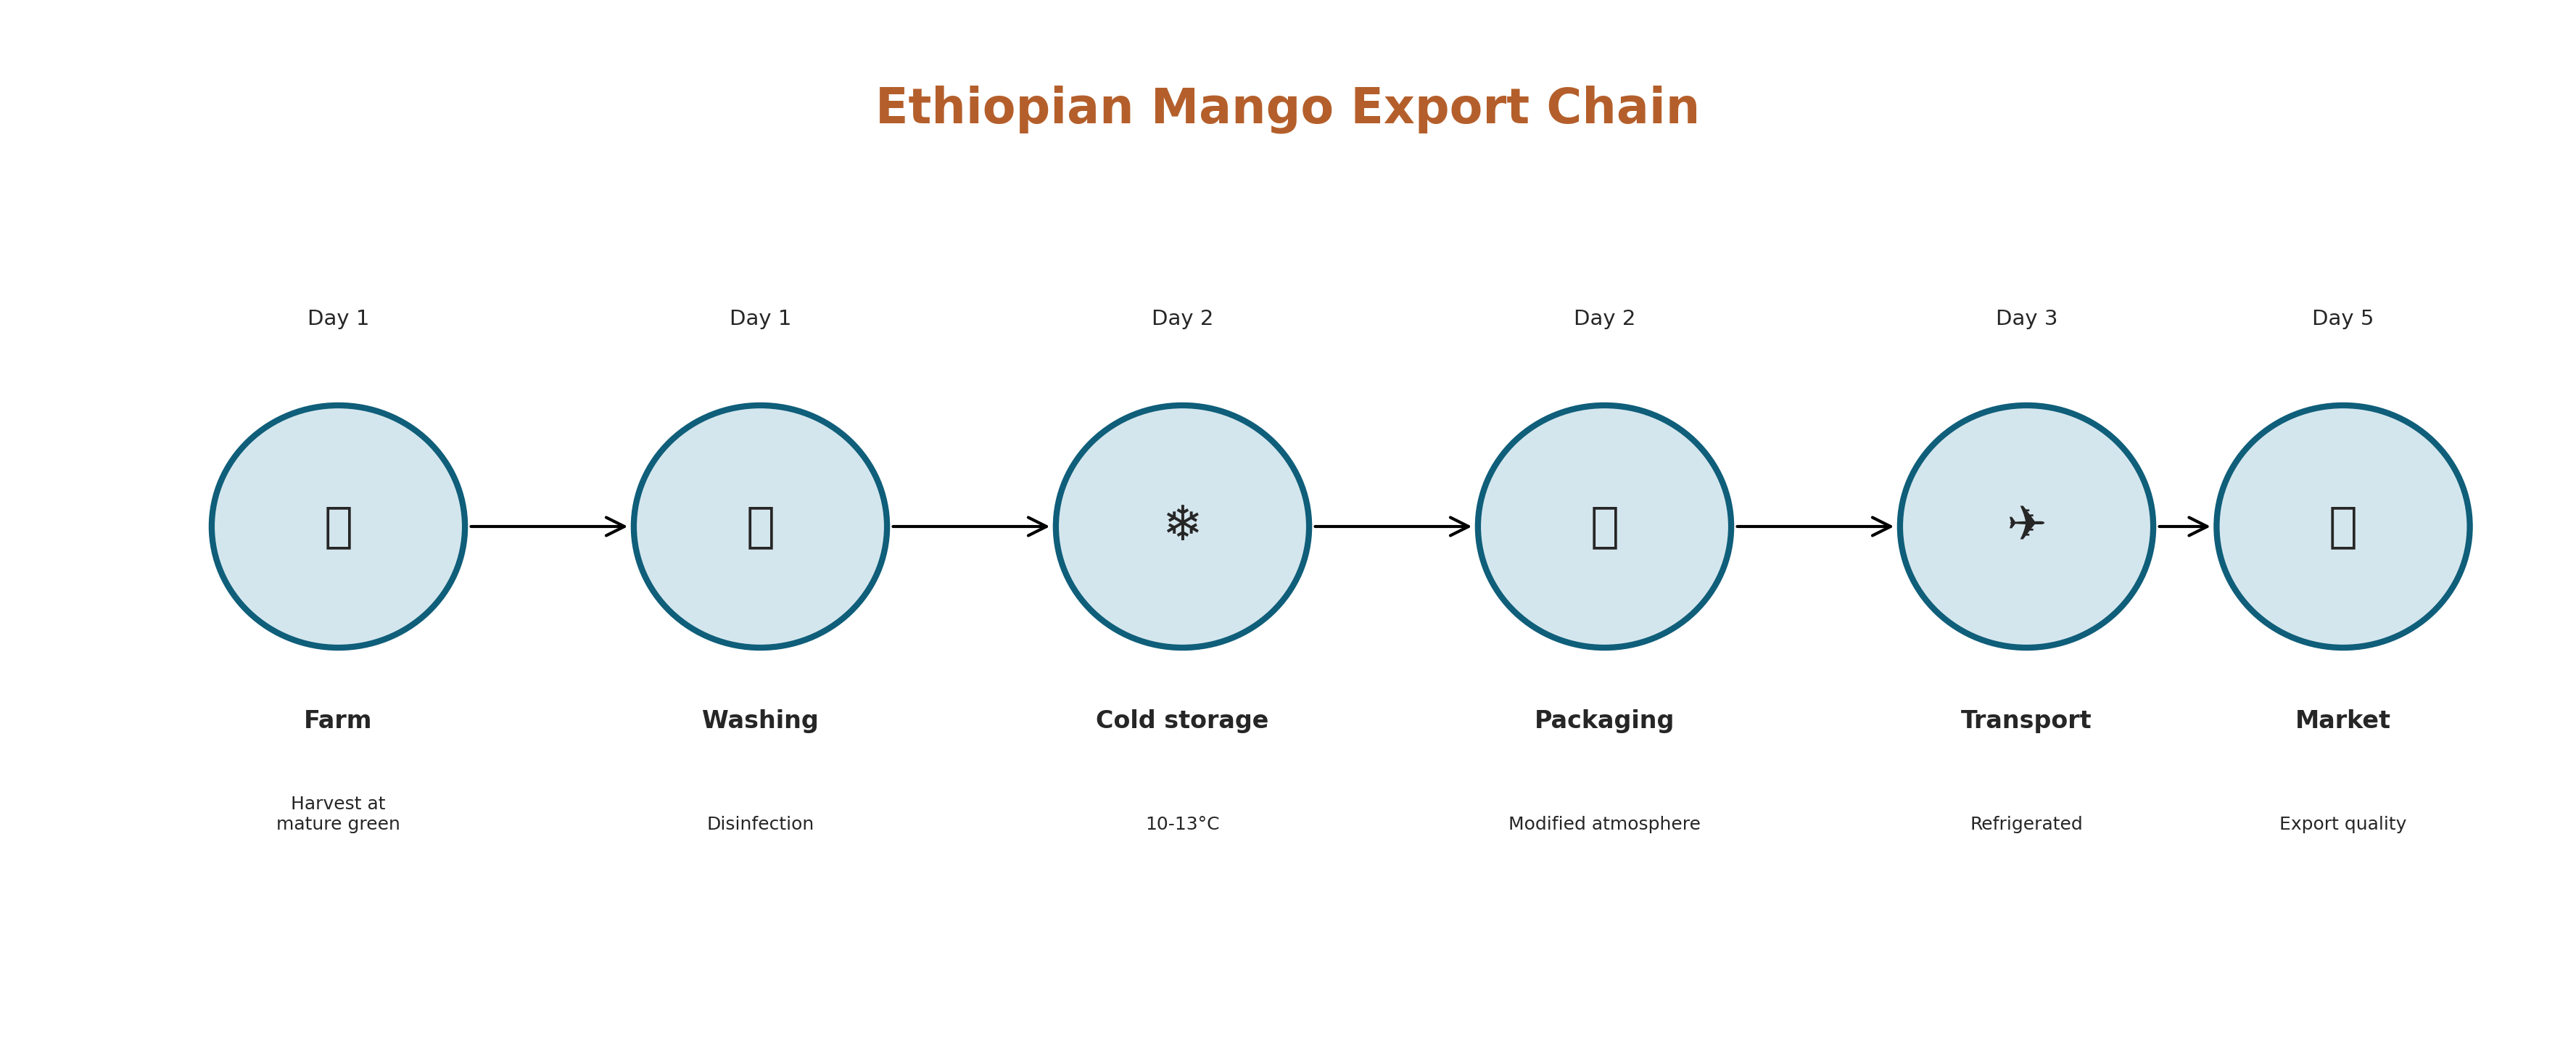
Ethiopian Mango Export Chain
Farm → washing → cold storage (10-13°C) → packaging → transport → market
images/06_09_mango_export_chain.png

Zero-Energy Evaporative Cooler
Charcoal-based cooling system reduces temperature from 30°C to 18°C
images/06_10_evaporative_cooling.png

Teff Grain Structure
Bran, endosperm (starch), germ. Nutritional: 8-11% protein, high iron and calcium
images/06_11_teff_grain.png

Injera Fermentation Process
Ersho starter → mixing → two-stage fermentation (LAB then yeasts) → baking on mitad
images/06_12_injera_fermentation.png

Injera Eye Formation
CO₂ from yeasts creates characteristic holes during baking
images/06_13_injera_eyes.png
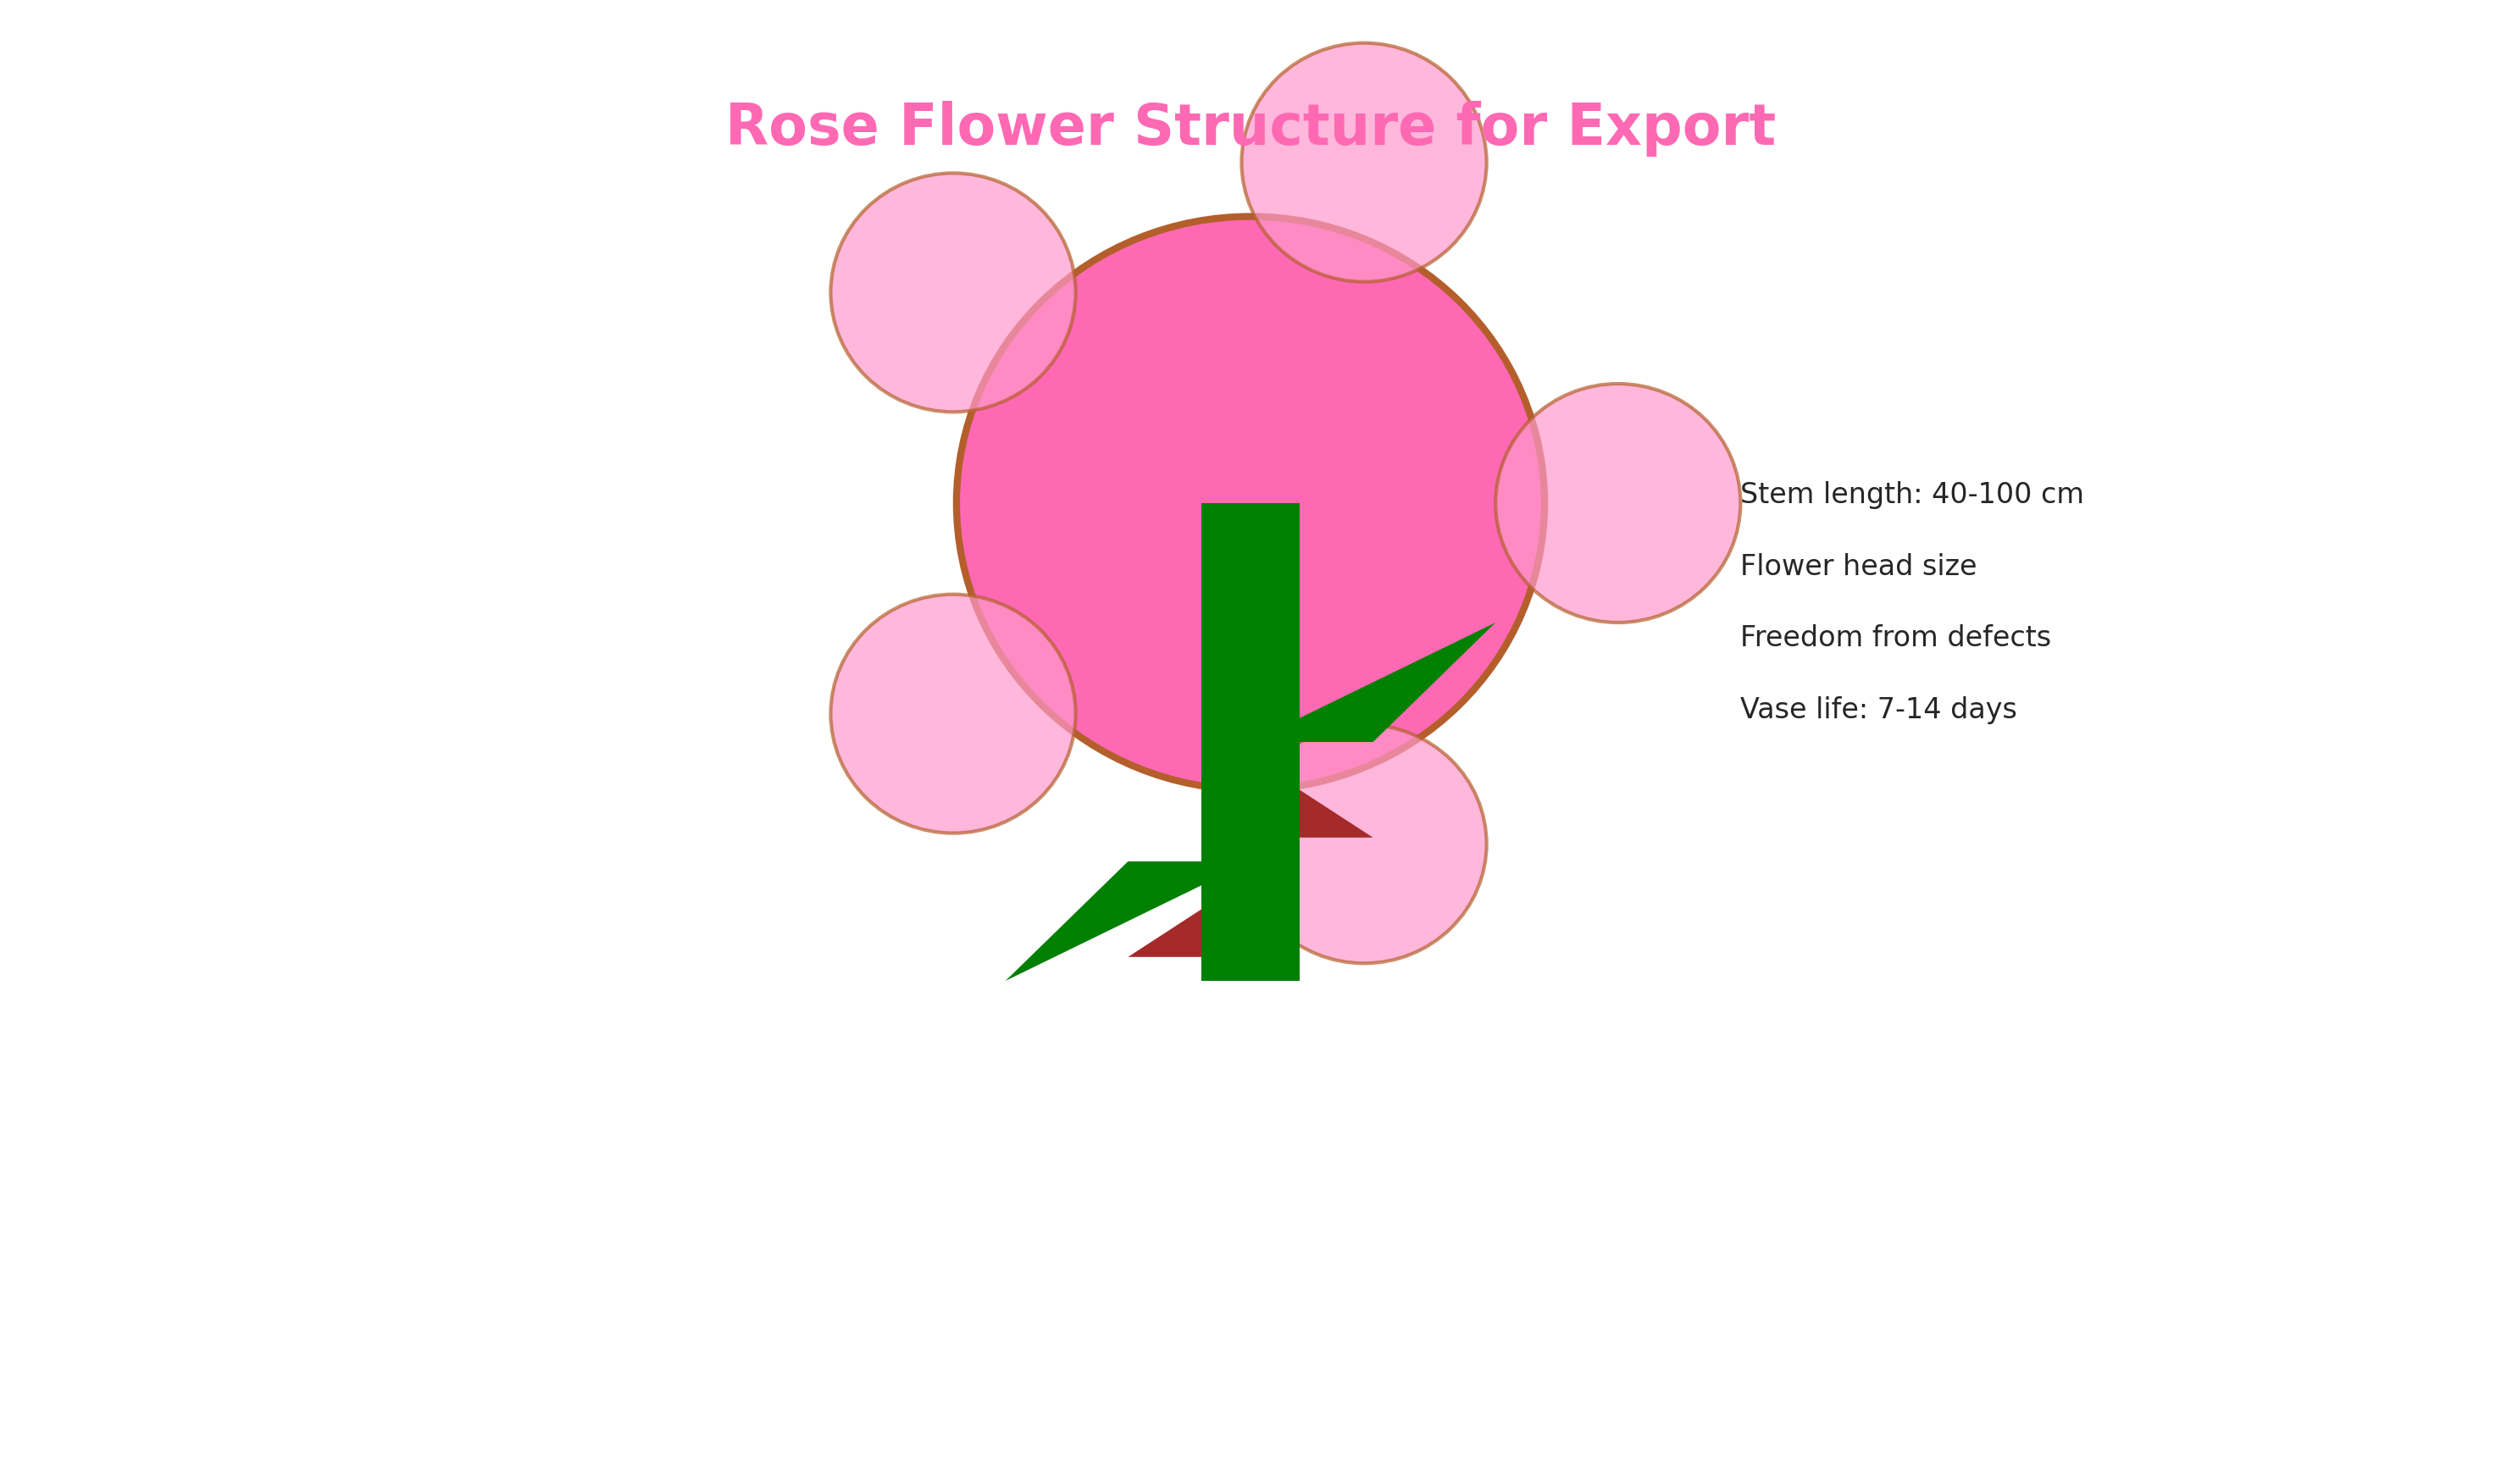
Rose Flower Structure for Export
Flower head, stem length (40-100 cm), leaves, thorns with grading criteria
images/06_14_rose_structure.png

Ethylene Management in Cut Flowers
Sources (engine exhaust, fruits, senescing flowers) and inhibitors (STS, 1-MCP)
images/06_15_ethylene_management.png

Cut Flower Grading Standards
Premium (70-100cm), Grade 1 (50-70cm), Grade 2 (30-50cm), Short (<30cm) with price premiums
images/06_16_flower_grading.png